Автор ХостМастерНа чтение 34 минПросмотров53Опубликовано
The ELK stack is a set of applications for retrieving and managing log files.
It is a collection of three open-source tools, Elasticsearch , Kibana , and Logstash . The stack can be further upgraded with Beats , a lightweight plugin for aggregating data from different data streams.
In this tutorial, learn how to install the ELK software stack on Ubuntu 18.04 / 20.04.
A Linux system running Ubuntu 20.04 or 18.04
Access to a terminal window/command line ( Search > Terminal )
A user account with sudo or root privileges
Java version 8 or 11 (required for Logstash)
26 августа, 2020 12:06 пп
Стек Elastic (ранее ELK) – это набор открытых программ, разработанных компанией Elastic , который позволяет выполнять поиск, анализ и визуализацию логов любого источника в любом формате. Такая практика называется централизованным логированием. Такое логирование очень полезно при выявлении проблем и неполадок сервера или приложения, поскольку все данные логов собираются в одном месте. Также с помощью этого можно очень быстро обнаружить неполадку, которая влияет на работу сразу нескольких серверов в кластере, сопоставив их логи за определенный период времени.
Стек Elastic включает четыре основных компонентов:
Elasticsearch : распределенная поисковая система RESTful
, которая хранит все собранные данные.
Logstash : компонент для обработки данных, который отправляет входящие данные на Elasticsearch.
Kibana : веб-интерфейс для поиска и визуализации логов.
Beats : легкие специализированные отправители данных; могут передавать данные на Logstash или Elasticsearch с сотен или тысяч машин.
Данный мануал поможет установить Elastic Stack на сервер Ubuntu 20.04. Вы узнаете, как установить все компоненты, включая Filebeat (Beat для пересылки и централизации логов и файлов), и настроить их для сбора и визуализации системных логов. Обычно Kibana устанавливается только на локальном хосте, потому мы настроим прокси Nginx, чтобы получить доступ к Kibana через веб-браузер. Мы установим все эти компоненты на один сервер.
Примечание : В стеке Elastic нужно использовать одинаковые версии всех компонентов. В этом мануале мы установим последние версии пакетов, это Elasticsearch 7.7.1, Kibana 7.7.1, Logstash 7.7.1, and Filebeat 7.7.1.
Сервер Ubuntu 20.04, настроенный по этому мануалу .
Объем CPU, RAM и хранилища сервера ELK зависит от объема логов, которые вы будете собирать. В данном мануале используется сервер с такими характеристиками: RAM: 4GB, CPU: 2.
OpenJDK 11 (инструкции по установке вы найдете в мануале Установка Java с помощью apt в Ubuntu 20.04 ).
Nginx, прокси-сервер для Kibana. Инструкции по установке можно найти здесь .
Также очень важно обеспечить безопасность сервера, поскольку стек Elastic используется для доступа к ценной информации, которую не должны видеть неавторизованные пользователи. Для этого создайте сертификат TLS/SSL. Это необязательно, но настоятельно рекомендуется сделать.
Настройка Nginx будет меняться, а потому вы можете выполнить Создание сертификата Let’s Encrypt для Nginx в Ubuntu 20.04 в конце второго раздела. Если вы собираетесь это сделать, вам понадобится:
FQDN. Здесь используется условный домен your_domain.
Две записи А – для www.your_domain и your_domain – указывающие на внешний IP-адрес сервера.
1: Установка и настройка Elasticsearch
Компоненты стека Elastic не доступны в стандартных репозиториях Ubuntu. Но их можно установить с помощью APT, если добавить исходный список Elastic.
Все пакеты Elastic Stack подписаны с помощью ключа Elasticsearch, чтобы защитить систему от подделки пакетов. Packages authenticated using the key will be considered trusted by your package manager. In this step, we will import the GPG Elasticsearch public key and add the Elastic package source list to install Elasticsearch.
Use the cURL command line tool to import the GPG Elasticsearch public key into APT. Note that we use the -fsSL arguments to suppress progress and potential errors (other than a server crash) and let cURL redirect the request. We pipe the output of the cURL command to apt-key, which adds the GPG public key to APT.
Then add the Elastic list to the sources.list.d directory, where the apt manager will look for new packages.
Update package index:
sudo apt update
Now just install Elasticsearch.
sudo apt install elasticsearch
After installing Elasticsearch, open a text editor to edit the main Elasticsearch configuration file, elasticsearch.yml. Here we will use nano:
sudo nano /etc/elasticsearch/elasticsearch.yml
Note : The Elasticsearch configuration file is written in YAML format, which means that indentation is very important. Make sure that no extra spaces appear when editing this file.
The elasticsearch.yml file provides configuration options for your cluster, nodes, paths, memory, network, discovery, and gateways. Most of these options have a default value, but you can change them to suit your needs. For a single server cluster, we will only change the settings for the network host.
Elasticsearch is listening on port 9200. You need to restrict external access to the Elasticsearch instance to prevent unauthorized users from reading your data or stopping the Elasticsearch cluster through the REST API. Find the network.host line, uncomment it and replace its value with localhost so it looks like this:
. . .
 # ---------------------------------- Network -----------------------------------
 #
 # Set the bind address to a specific IP (IPv4 or IPv6):
 #
 network.host: localhost
 . . .
This is the minimum setup required to run Elasticsearch.
You can now start the Elasticsearch service for the first time using systemctl:
sudo systemctl start elasticsearch
Then add the service to autostart so that Elasticsearch starts every time your server boots:
sudo systemctl enable elasticsearch
Verify that the Elasticsearch service is running by sending an HTTP request:
curl -X GET "localhost:9200"
You will see basic information about your localhost:
The Elasticsearch search engine is installed and running.
2: Installing and configuring Kibana
According to official documentation , Kibana should only be installed after Elasticsearch. This order ensures that all dependent programs are installed correctly.
Since you’ve already added the Elastic source list, for now you can just install the rest of the stack with apt:
sudo apt install kibana
To enable the Kibana service, enter:
sudo systemctl enable kibana
 sudo systemctl start kibana
Since Kibana only listens on the local host, you need to set up a reverse proxy to allow external access to the service. For this purpose, we will use Nginx, which should already be installed on your server (according to the requirements for the manual).
Enter and confirm the password on the command line. Make a note of these details as you will need them to access the Kibana web interface.
Next, you need to create the Nginx server block file. We’re using the default your_domain, but you can choose a more descriptive name. For example, if the server has FQDN and DNS records, you can name this file with your domain name:
sudo nano /etc/nginx/sites-available/your_domain
Note that if you’ve completed the Nginx manual (from the requirements), you’ve probably already created such a file and filled it with some code. In this case, delete all existing content in the file, and then add this code.
Save and close the file.
Enable the new configuration by adding a symlink to the sites-enabled directory. If you created a server block file with the same name earlier, you don’t need to do this.
If the output of the command reports errors, go back to the file and check the code you put in the configuration file. After fixing the errors, run the command again (the output should read syntax is ok ) and restart Nginx:
sudo systemctl reload nginx
If you followed the initial server setup manual, you must have the UFW firewall enabled. To allow connections to Nginx, you need to configure the firewall by typing:
sudo ufw allow 'Nginx Full'
Note : If you followed the Nginx installation manual, you probably created a UFW rule earlier to allow the Nginx HTTP profile. Since the Nginx Full profile supports both HTTP and HTTPS traffic, you can simply remove this rule with the following command:
sudo ufw delete allow 'Nginx HTTP'
On the page you will see information about resource usage and installed plugins.
Note : The requirements mentioned that the server needs to be secured with an SSL/TLS certificate. Now is the time to do it. Instructions can be found here .
3: Installing and configuring Logstash
Beats can send data directly to the Elasticsearch database, but we recommend using Logstash to process the data. This will allow you to collect data from different sources, convert it to a common format, and export it to another database.
Install Logstash with this command:
sudo apt install logstash
Create a config file 02-beats-input.conf to configure Filebeat input.
Insert the following output configuration. Essentially, these settings configure Logstash to store the Beats data in the Elasticsearch database (localhost:9200) in an index named after the Beat in use. The beat used in this manual is called Filebeat.
Save and close the file.
Check your Logstash configuration:
If there are no errors, after a few seconds the output will say “Config Validation Result: OK. Exit Logstash». If you don’t see this message in the output, check for errors and update your configuration to fix them.
If the configuration check was successful, start and enable Logstash for the changes to take effect:
sudo systemctl start logstash
 sudo systemctl enable logstash
4: Installing and configuring Filebeat
Elastic Stack uses several simple Beats clients to collect data from various sources and feed it to Logstash or Elasticsearch. Here are the Beats currently available on Elastic:
In this tutorial, we use Filebeat, a client to push logs to the Elastic stack.
sudo apt install filebeat
Then set up Filebeat to connect to Logstash. Edit the sample configuration file that comes with Filebeat. Open the file.
sudo nano /etc/filebeat/filebeat.yml
Note : As with Elasticsearch, Filebeat’s config file is in YAML format and proper indentation is very important.
Filebeat supports a lot of output, but events are usually sent directly to Elasticsearch or to Logstash for processing. In this tutorial, we will be using Logstash to further process the data collected by Filebeat. The Filebeat client won’t need to send data to Elasticsearch directly, so let’s disable this output. To do this, find the output.elasticsearch section and comment out the following lines by prefixing them with a # sign:
Save and close the file.
Filebeat functionality can be extended with modules . In this manual we will use the module system , which collects and analyzes logs generated by the Linux syslog service.
sudo filebeat modules enable system
You can get a list of enabled and disabled modules using:
By default, Filebeat uses the default syslog and authorization log paths. In this case, nothing needs to be changed in the configuration. You can see the module options in the /etc/filebeat/modules.d/system.yml file.
Next, we need to set up the Filebeat ingestion pipelines that parse the log data before sending it to logstash and then to Elasticsearch. To load the pipeline for the system module, enter the following command:
sudo filebeat setup --pipelines --modules system
Then upload the index template to Elasticsearch. Elasticsearch Index is a set of documents that have similar characteristics. Indexes are defined by name. The name is used to refer to the index when performing various operations on it. The index template will automatically be used when creating a new index.
To download the template, use the following command:
Filebeat comes with sample Kibana dashboards that allow you to visualize Filebeat data in Kibana. Before you can use dashboards, you need to create an index template and upload the dashboard to Kibana.
When the dashboard is loaded, Filebeat will connect to Elasticsearch to check the version information. If Logstash is enabled, you need to disable Logstash output and enable Elasticsearch output in order to load dashboards.
You will see something like this:
Overwriting ILM policy is disabled. Set `setup.ilm.overwrite:true` for enabling.
Index setup finished.
Loading dashboards (Kibana must be running and reachable)
Loaded dashboards
Setting up ML using setup --machine-learning is going to be removed in 8.0.0. Please use the ML app instead.
See more: https://www.elastic.co/guide/en/elastic-stack-overview/current/xpack-ml.html
Loaded machine learning job configurations
Loaded Ingest pipelines
Now you can start Filebeat and add it to startup:
sudo systemctl start filebeat
 sudo systemctl enable filebeat
If you have configured your Elastic stack correctly, Filebeat will start sending system log and authorization logs to Logstash, which will then upload this data to Elasticsearch.
To verify that Elasticsearch is actually getting this data, query the Filebeat index with this command:
If your output shows 0 total hits, Elasticsearch is not uploading logs to the index you were looking for, and you will need to check your settings for errors. If you get the result you expect, move on to the next section where you will learn how to work with Kibana dashboards.
5: Kibana Dashboards
Now let’s see how Kibana works.
In a browser, open the FQDN or external IP of the Elastic server. Enter your credentials from section 2 and you will be taken to the Kibana home page.
Click Discover in the left navigation bar. On the Discover page, select the filebeat-* predefined index pattern to see Filebeat data. By default, all log data for the last 15 minutes will be shown. You will see a bar graph with events and some log messages.
Here you can search and view logs, as well as customize dashboards. At the moment, however, there won’t be much data there, because right now only the system logs of the Elastic Stack server are displayed.
Use the left pane to go to the Dashboard page and search for Filebeat System. Once there, you can look for sample dashboards that come with the system module.
For example, you can view detailed statistics based on your system log messages, or find out which users used the sudo command and when.
Kibana has many other features such as plotting and filters. Explore them yourself.
Conclusion
Now you know how to install and configure the Elastic stack for centralized collection and analysis of system logs. Remember that you can send almost any type of log or indexed data to Logstash using Beats , but the data is even more useful if it is parsed and structured using Logstash filters: this converts it into a consistent format that Elasticsearch can easily read.
The Elastic Stack (formerly ELK) is a set of open source programs developed by Elastic , which allow you to search, analyze and visualize logs of any source in any format. This practice is called centralized logging. Centralized logging is very useful in troubleshooting server or application issues, as all logging data is collected in one place. Also, using this, you can very quickly detect a problem that affects the operation of several servers in a cluster at once by comparing their logs for a certain period of time.
The Elastic stack consists of four main components:
Elasticsearch : distributed search engine RESTful , which stores all the collected data.
Logstash : The data processing component that sends incoming data to Elasticsearch.
Kibana : web interface for searching and visualizing logs.
Beats : light specialized data senders; can send data to Logstash or Elasticsearch from hundreds or thousands of machines.
This manual will help you install Elastic Stack to Ubuntu Server 18.04. You will learn how to install all components, including Filebeat (Beat for sending and centralizing logs and files), and configure them to collect and visualize system logs. Also, Kibana is usually only on localhost, so we’ll set up an Nginx proxy to access Kibana through a web browser. We will install all these components on one server.
Note A: When installing an Elastic stack, you must use the same version of all components. In this guide, we will install the latest versions, at the time of writing these are Elasticsearch 6.4.3, Kibana 6.4.3, Logstash 6.4.3 and Filebeat 6.4.3.
Requirements
Ubuntu 18.04 server configured by this manual .
The amount of CPU, RAM and storage of the Elastic server depends on the amount of logs you will collect. This guide uses a server with the following specifications: RAM: 4GB, CPU: 2.
Java 8 — Elasticsearch and Logstash dependency. Java 9 is not supported. To install Java 8, read the manual Installing Java with apt on Ubuntu 18.04 .
Nginx, proxy server for Kibana. Installation instructions can be found here .
In addition, it is important to ensure the security of the server, since the Elastic Stack is used to access valuable information that unauthorized users should not see. To do this, create a TLS/SSL certificate. This is optional, but highly recommended.
Nginx setup will change, so you can follow Create a Let’s Encrypt Certificate for Nginx on Ubuntu 18.04 at the end of the second section. If you are going to do this, you will need:
FQDN. Here the conditional domain example.com is used.
Two A records for www.example.com and example.com pointing to the external IP address of the server.
1: Installing and configuring Elasticsearch
Elastic stack components are not in the standard Ubuntu repositories. But they can be installed with APT by adding the Elastic source list.
All Elastic Stack packages are signed with an Elasticsearch key to protect the system from package tampering. Packages authenticated using the key will be considered trusted by your package manager. In this step, we will import the GPG Elasticsearch public key and add the Elastic package source list to install Elasticsearch.
To import the GPG key, enter the command:
Then add the Elastic list to the sources.list.d directory, where the apt manager will look for new packages.
Update package index:
sudo apt update
Now just install Elasticsearch.
sudo apt install elasticsearch
After the installation of Elasticsearch is complete, use a text editor to edit the main Elasticsearch configuration file, elasticsearch.yml. Here we will use nano:
sudo nano /etc/elasticsearch/elasticsearch.yml
Note : The Elasticsearch config file is in YAML format, which means that indentation is very important. Make sure that no extra spaces appear when editing this file.
Elasticsearch listens for traffic on port 9200. You need to restrict external access to the Elasticsearch instance to prevent outsiders from reading your data or stopping the Elasticsearch cluster through the REST API. Find the network.host line, uncomment it and replace its value with localhost so it looks like this:
. . .
network.host: localhost
. . .
Save and close the file.
Now start the Elasticsearch service:
sudo systemctl start elasticsearch
Then run the following command to start Elasticsearch every time your server boots:
sudo systemctl enable elasticsearch
Verify that the Elasticsearch service is running by sending an HTTP request:
curl -X GET "localhost:9200"
You will see basic information about your localhost:
The Elasticsearch search engine is installed.
2: Installing and configuring Kibana
According to official documentation , you should install Kibana only after installing Elasticsearch. This order ensures that all dependent programs are installed correctly.
Since you’ve already added the Elastic source list, for now you can just install the rest of the Elastic Stack components using apt:
Since Kibana only listens on the local host, you need to set up a reverse proxy to allow external access to the service. For this purpose, we will use Nginx, which should already be installed on your server (as required).
Enter and confirm the password on the command line. Make a note of these details as you will need them to access the Kibana web interface.
Next, you need to create the Nginx server block file. We’re using the example.com domain, but you can choose a more descriptive name. For example, if the server has FQDN and DNS records, you can name this file with your domain name:
sudo nano /etc/nginx/sites-available/example.com
Note that if you’ve completed the Nginx manual (from the requirements), you’ve probably already created such a file and filled it with some code. In this case, delete all existing content in the file, and then add this code.
Save and close the file.
Enable the new configuration by adding a symlink to the sites-enabled directory. If you created a server block file with the same name earlier, you don’t need to do this.
If the output of the command reports errors, go back to the file and check the code you put in the configuration file. After fixing the errors, run the command again (the output should read syntax is ok ) and restart Nginx:
sudo systemctl restart nginx
If you followed the initial server setup manual, you must have the UFW firewall enabled. To allow connections to Nginx, you need to configure the firewall by typing:
sudo ufw allow 'Nginx Full'
Note : If you followed the Nginx installation manual, you probably created a UFW rule earlier to allow the Nginx HTTP profile. Since the Nginx Full profile supports both HTTP and HTTPS traffic, you can simply remove this rule with the following command:
sudo ufw delete allow 'Nginx HTTP'
On the page you will see information about resource usage and installed plugins.
Note : The requirements mentioned that the server needs to be secured with an SSL/TLS certificate. Now is the time to do it. Instructions can be found here .
3: Installing and configuring Logstash
Beats can send data directly to the Elasticsearch database, but we recommend using Logstash to process the data. This will allow you to collect data from different sources, convert it to a common format, and export it to another database.
Install Logstash with this command:
sudo apt install logstash
Create a config file 02-beats-input.conf to configure Filebeat input.
Paste the following configuration for the syslog filter. This configuration example is taken from the official Elastic documentation . Such a filter is used to analyze incoming system logs, which makes them structured and suitable for use in Kibana dashboards:
Save and close the file.
Now create the configuration file 30-elasticsearch-output.conf:
Paste the following output configuration. Essentially, these settings configure Logstash to store the Beats data in the Elasticsearch database (localhost:9200) in an index named after the Beat in use. The beat used in this tutorial is called Filebeat.
Save and close the file.
If you want to add filters for other apps that use the Filebeat input, be sure to name the files so that they are sorted between input and output configurations (i.e. filenames must start with a two-digit number between 02 and 30).
Check your Logstash configuration:
If there are no syntax errors, the output will report «Configuration OK» after a few seconds. If you don’t see this message in the output, check for errors and update your configuration to fix them.
If the configuration check was successful, start and enable Logstash for the changes to take effect:
The Elastic Stack uses several simple data clients called Beats to collect data from various sources and feed it to Logstash or Elasticsearch. Here are the Beats currently available on Elastic:
In this tutorial, we use Filebeat to push logs to the Elastic stack.
sudo apt install filebeat
Then set up Filebeat to connect to Logstash. Edit the sample configuration file that comes with Filebeat. Open the file.
sudo nano /etc/filebeat/filebeat.yml
Note : As with Elasticsearch, the Filebeat configuration file is in YAML format. This means that correct indentation is very important.
Filebeat supports a lot of output, but usually events are sent directly to Elasticsearch or to Logstash for processing. In this tutorial, we will be using Logstash to further process the data collected by Filebeat. Filebeat won’t need to directly send data to Elasticsearch, so let’s disable this output. To do this, find the output.elasticsearch section and comment out the following lines by prefixing them with a # sign:
Save and close the file.
Filebeat functionality can be extended with Filebeat modules . In this manual we will use the module system , which collects and analyzes logs generated by Linux distributions’ syslog service.
sudo filebeat modules enable system
You can get a list of enabled and disabled modules using:
sudo filebeat modules list
Enabled:
system
Disabled:
apache2
auditd
elasticsearch
icinga
iis
kafka
kibana
logstash
mongodb
mysql
nginx
osquery
postgresql
redis
traefik
By default, Filebeat uses the default syslog and authorization log paths. In this case, nothing needs to be changed in the configuration. You can see the module options in the /etc/filebeat/modules.d/system.yml file.
Then upload the index template to Elasticsearch. Elasticsearch Index is a set of documents that have similar characteristics. Indexes are defined by name. The name is used to refer to the index when performing various operations on it. The index template will automatically be used when creating a new index.
To download the template, use the following command:
Filebeat comes with sample Kibana dashboards that allow you to visualize Filebeat data in Kibana. Before you can use dashboards, you need to create an index template and upload the dashboard to Kibana.
When the dashboard is loaded, Filebeat will connect to Elasticsearch to check the version information. If Logstash is enabled, you need to disable Logstash output and enable Elasticsearch output in order to load dashboards.
2018-09-10T08:39:15.844Z INFO instance/beat.go:273 Setup Beat: filebeat; Version: 6.4.2
2018-09-10T08:39:15.845Z INFO elasticsearch/client.go:163 Elasticsearch url: http://localhost:9200
2018-09-10T08:39:15.845Z INFO pipeline/module.go:98 Beat name: elk
2018-09-10T08:39:15.845Z INFO elasticsearch/client.go:163 Elasticsearch url: http://localhost:9200
2018-09-10T08:39:15.849Z INFO elasticsearch/client.go:708 Connected to Elasticsearch version 6.4.2
2018-09-10T08:39:15.856Z INFO template/load.go:129 Template already exists and will not be overwritten.
Loaded index template
Loading dashboards (Kibana must be running and reachable)
2018-09-10T08:39:15.857Z INFO elasticsearch/client.go:163 Elasticsearch url: http://localhost:9200
2018-09-10T08:39:15.865Z INFO elasticsearch/client.go:708 Connected to Elasticsearch version 6.4.2
2018-09-10T08:39:15.865Z INFO kibana/client.go:113 Kibana url: http://localhost:5601
2018-09-10T08:39:45.357Z INFO instance/beat.go:659 Kibana dashboards successfully loaded.
Loaded dashboards
2018-09-10T08:39:45.358Z INFO elasticsearch/client.go:163 Elasticsearch url: http://localhost:9200
2018-09-10T08:39:45.361Z INFO elasticsearch/client.go:708 Connected to Elasticsearch version 6.4.2
2018-09-10T08:39:45.361Z INFO kibana/client.go:113 Kibana url: http://localhost:5601
2018-09-10T08:39:45.455Z WARN fileset/modules.go:388 X-Pack Machine Learning is not enabled
Если вы правильно настроили свой Elastic Stack, Filebeat начнет отправку системного лога и логов авторизации в Logstash, который затем загрузит эти данные в Elasticsearch.
Чтобы убедиться, что Elasticsearch действительно получает эти данные, запросите индекс Filebeat с помощью этой команды:
Если ваши выходные данные показывают 0 total hits, Elasticsearch не загружает логи в индекс, который вы искали, и вам нужно будет проверить настройки на наличие ошибок. Если вы получили ожидаемый результат, переходите к следующему разделу, в котором вы узнаете, как работать с дашбордами Kibana.
5: Дашборды Kibana
Теперь давайте посмотрим, как работает Kibana.
В браузере откройте FQDN или внешний IP сервера Elastic. Введите свои учетные данные из раздела 2, и вы попадете на домашнюю страницу Kibana.
Нажмите Discover в левой панели навигации. На странице Discover выберите предопределенный шаблон индекса filebeat-*, чтобы увидеть данные Filebeat. По умолчанию будут показаны все данные лога за последние 15 минут. Вы увидите гистограмму с событиями и некоторыми сообщениями лога.
Здесь вы можете искать и просматривать логи, а также настраивать дашборды. На данный момент, однако, там не будет много данных, потому что сейчас отображаются только системные логи сервера Elastic Stack.
Используйте левую панель, чтобы перейти на страницу Dashboard и выполнить поиск по Filebeat System. Оказавшись там, вы можете искать примеры дашбордов, которые поставляются с модулем system.
Например, вы можете просмотреть подробную статистику на основе ваших сообщений системного лога или узнать, какие пользователи и когда использовали команду sudo.
У Kibana есть много других функций, таких как построение графиков и фильтров. Исследуйте их самостоятельно.
Заключение
Теперь вы знаете, как установить и настроить Elastic Stack для сбора и анализа системных логов. Помните, что вы можете отправлять в Logstash практически любой тип лога или индексированных данных, используя Beats, но данные будут еще более полезными, если их анализировать и структурировать с помощью фильтров Logstash: это преобразует их в согласованный формат, который Elasticsearch легко прочитает.
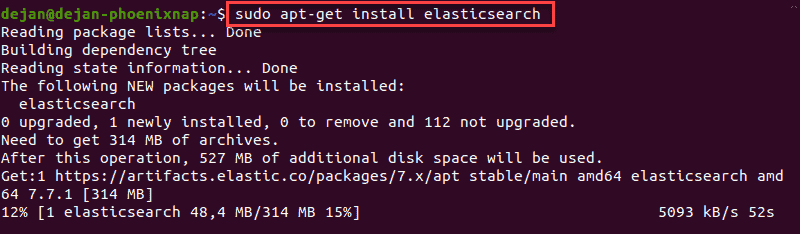
1. Prior to installing Elasticsearch, update the repositories by entering:
sudo apt-get update
sudo apt-get install elasticsearch
Configure Elasticsearch
1. Elasticsearch uses a configuration file to control how it behaves. Open the configuration file for editing in a text editor of your choice. We will be using nano:
sudo nano /etc/elasticsearch/elasticsearch.yml
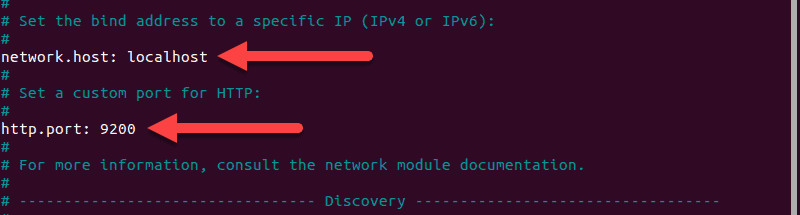
#network.host: 192.168.0.1
#http.port: 9200
3. Uncomment the lines by deleting the hash ( #
) sign at the beginning of both lines and replace 192.168.0.1
with localhost
.
It should read:
network.host: localhost
http.port: 9200
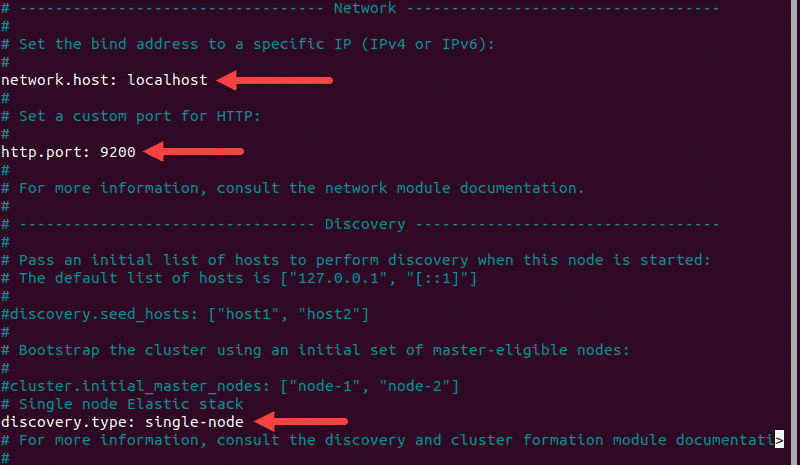
4. Just below, find the Discovery section. We are adding one more line, as we are configuring a single node cluster:
discovery.type: single-node
For further details, see the image below.
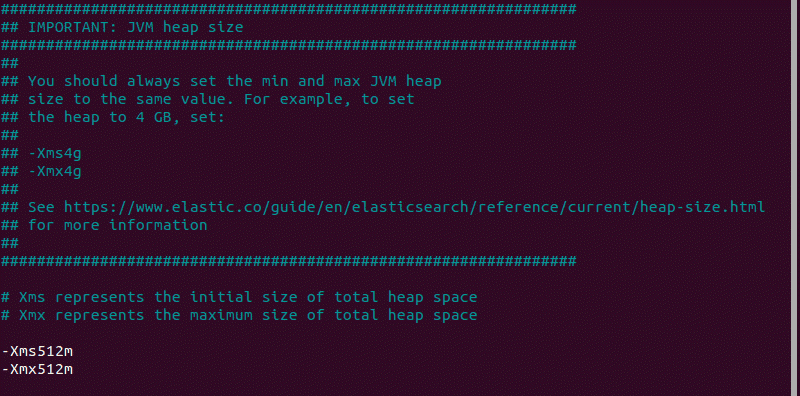
sudo nano /etc/elasticsearch/jvm.options
6. Find the lines starting with -Xms
and -Xmx
. In the example below, the maximum ( -Xmx
) and minimum ( -Xms
) size is set to 512MB.
Start Elasticsearch
1. Start the Elasticsearch service by running a systemctl
command:
sudo systemctl start elasticsearch.service
It may take some time for the system to start the service. There will be no output if successful.
2. Enable Elasticsearch to start on boot:
sudo systemctl enable elasticsearch.service
Test Elasticsearch
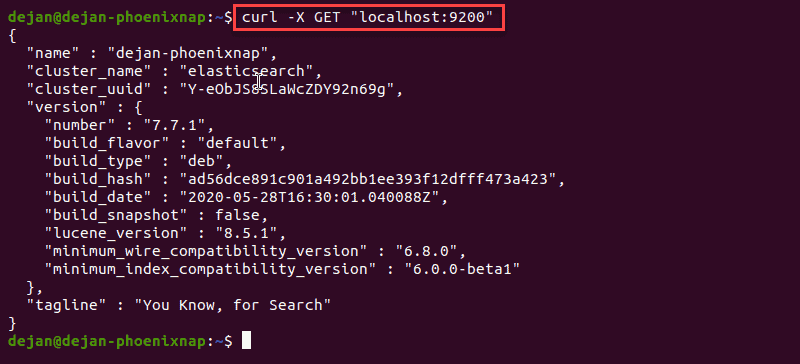
curl -X GET "localhost:9200"
The name of your system should display, and elasticsearch for the cluster name. This indicates that Elasticsearch is functional and is listening on port 9200 .
Install Logstash
Logstash is a tool that collects data from different sources. The data it collects is parsed by Kibana and stored in Elasticsearch.
sudo apt-get install logstash
Start and Enable Logstash
1. Start the Logstash service:
sudo systemctl start logstash
2. Enable the Logstash service:
sudo systemctl enable logstash
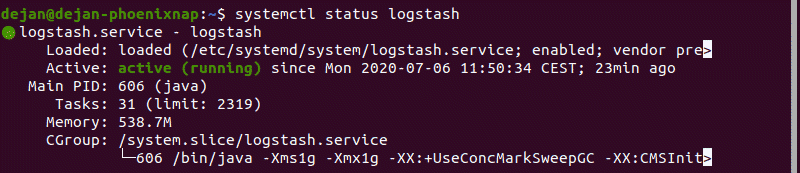
sudo systemctl status logstash
Configure Logstash
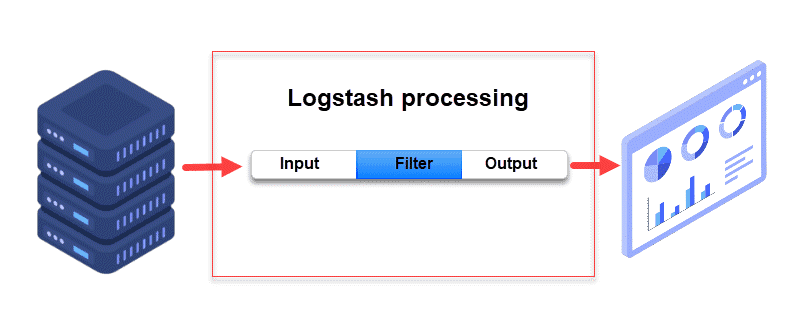
Logstash is a highly customizable part of the ELK stack. Once installed, configure its INPUT , FILTERS , and OUTPUT pipelines according to your own individual use case.
All custom Logstash configuration files are stored in /etc/logstash/conf.d/ .
Install Kibana
sudo apt-get install kibana
2. Allow the process to finish. Once finished, it’s time to configure Kibana.
Configure Kibana
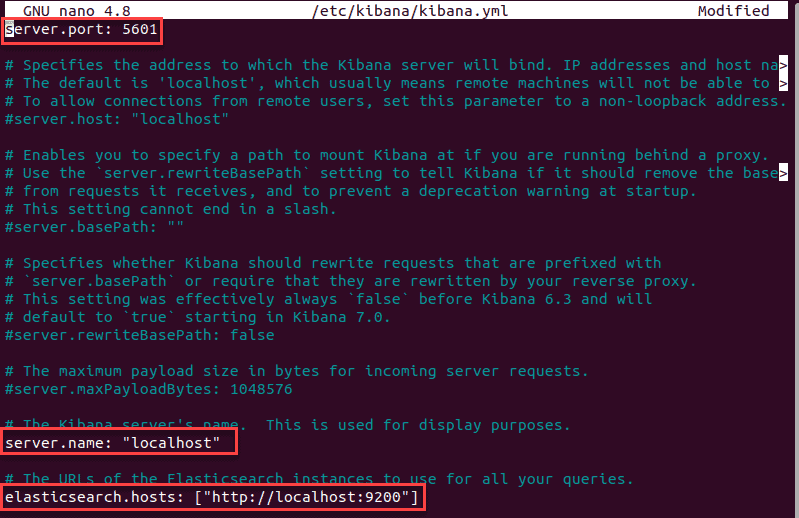
1. Next, open the kibana.yml configuration file for editing:
sudo nano /etc/kibana/kibana.yml
#server.port: 5601
#server.host: "your-hostname"
#elasticsearch.hosts: ["http://localhost:9200"]
server.port: 5601
server.host: "localhost"
elasticsearch.hosts: ["http://localhost:9200"]
3. Save the file (Ctrl+ o
) and exit (Ctrl+ x
).
Note: This configuration allows traffic from the same system Elasticstack is configured on. You can set the server.host
value to the address of a remote server.
Start and Enable Kibana
1. Start the Kibana service:
sudo systemctl start kibana
There is no output if the service starts successfully.
2. Next, configure Kibana to launch at boot:
sudo systemctl enable kibana
Allow Traffic on Port 5601
If the UFW firewall is enabled on your Ubuntu system, you need to allow traffic on port 5601 to access the Kibana dashboard.
sudo ufw allow 5601/tcp
Test Kibana
http://localhost:5601
The Kibana dashboard loads.
If you receive a “Kibana server not ready yet” error, check if the Elasticsearch and Kibana services are active.
Note: Check out our in-depth Kibana tutorial to learn everything you need to know visualization and data query.
Add Elastic Repository
Elastic repositories enable access to all the open-source software in the ELK stack. To add them, start by importing the GPG key.
2. The system should respond with OK , as seen in the image below.
3. Next, install the apt-transport-https package:
sudo apt-get install apt-transport-https
4. Add the Elastic repository to your system’s repository list:
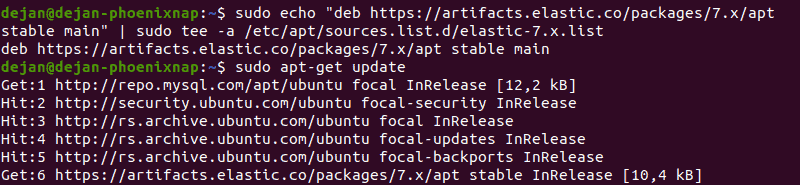
echo "deb https://artifacts.elastic.co/packages/7.x/apt stable main" | sudo tee –a /etc/apt/sources.list.d/elastic-7.x.list
Install Filebeat
Filebeat is a lightweight plugin used to collect and ship log files. It is the most commonly used Beats module. One of Filebeat’s major advantages is that it slows down its pace if the Logstash service is overwhelmed with data.
sudo apt-get install filebeat
Let the installation complete.
Note: Make sure that the Kibana service is up and running during the installation and configuration procedure.
Configure Filebeat
Filebeat, by default, sends data to Elasticsearch. Filebeat can also be configured to send event data to Logstash.
1. To configure this, edit the filebeat.yml configuration file:
sudo nano /etc/filebeat/filebeat.yml
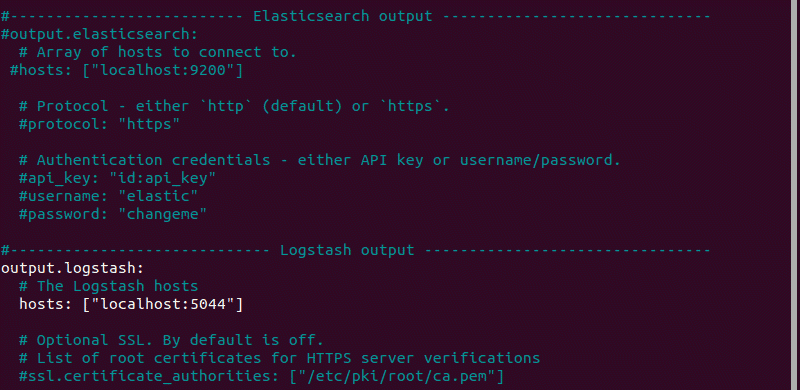
# output.elasticsearch: # Array of hosts to connect to. # hosts: ["localhost:9200"]
# output.logstash # hosts: ["localhost:5044"]
It should look like this:
output.logstash hosts: ["localhost:5044"]
For further details, see the image below.
4. Next, enable the Filebeat system module, which will examine local system logs:
sudo filebeat modules enable system
The output should read Enabled system
.
5. Next, load the index template:
The system will do some work, scanning your system and connecting to your Kibana dashboard.
sudo systemctl enable elasticsearch.service Start and Enable Filebeat
Start and enable the Filebeat service:
curl -X GET "localhost:9200"
Verify Elasticsearch Reception of Data Finally, verify if Filebeat is shipping log files to Logstash for processing. Once processed, data is sent to Elasticsearch. #192.168.0.1 Now you have a functional ELK stack installed on your Ubuntu system. We recommend defining your requirements and start adjusting ELK for your needs. This powerful monitoring tool localhost can be customized for individual use cases.
Customize data streams with Logstash, use different Beats modules to gather various types of data, and utilize Kibana for easy browsing through log files.
Install Dependencies network.host: localhost
Install Java
http.port: 9200 The ELK stack requires Java 8 to be installed. Some components are compatible with Java 9, but not Logstash.
The output you are looking for is
discovery.type: single-node
.
That would indicate that Java 8 is installed.
If you already have Java 8 installed, skip to Install Nginx.
sudo nano /etc/elasticsearch/jvm.options
2. If prompted, type -Xms
and hit Enter for the process to finish.
-Xmx-Xmx
Install Nginx
-Xms Nginx works as a web server and
proxy server . It’s used to configure password-controlled access to the Kibana dashboard.
2. If prompted, type systemctl
and hit sudo systemctl start elasticsearch.service Enter