

In this article, we’ll walk you through installing and configuring Grafana, how to use this tool, how to connect external data sources, and much more.
Grafana is an open source tool for visualizing data from various statistics collection systems. Used for graphical presentation of time series and textual data.
Grafana supports installation on the most popular operating systems: Linux (Debian, Ubuntu, CentOS, Fedora, OpenSuse, RedHat), Mac and Windows. Valid databases that can store user and dashboard data are SQLite (the default), MySQL, and PostgreSQL. As demo servers, we will use Cloud Servers with CentOS Stream and Ubuntu operating systems, on which we will install Grafana with an SQLite database.
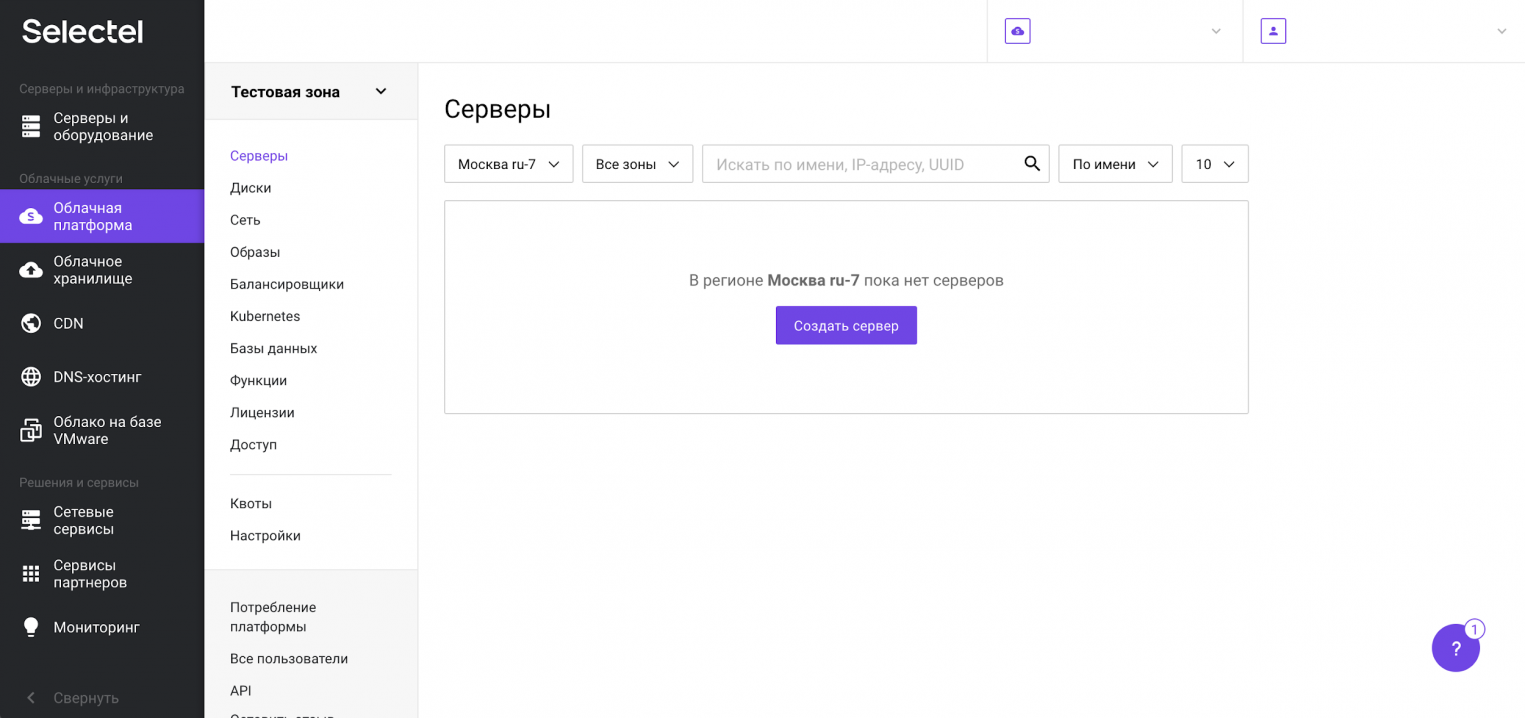
Before starting the installation of Grafana, let’s prepare the servers. In the Selectel management console, go to the Cloud platform section and click the Create server button.
In the next view, we will choose a ready-made server configuration with 1 vCPU and 1 GB of RAM running CentOS 8 64-bit operating system.
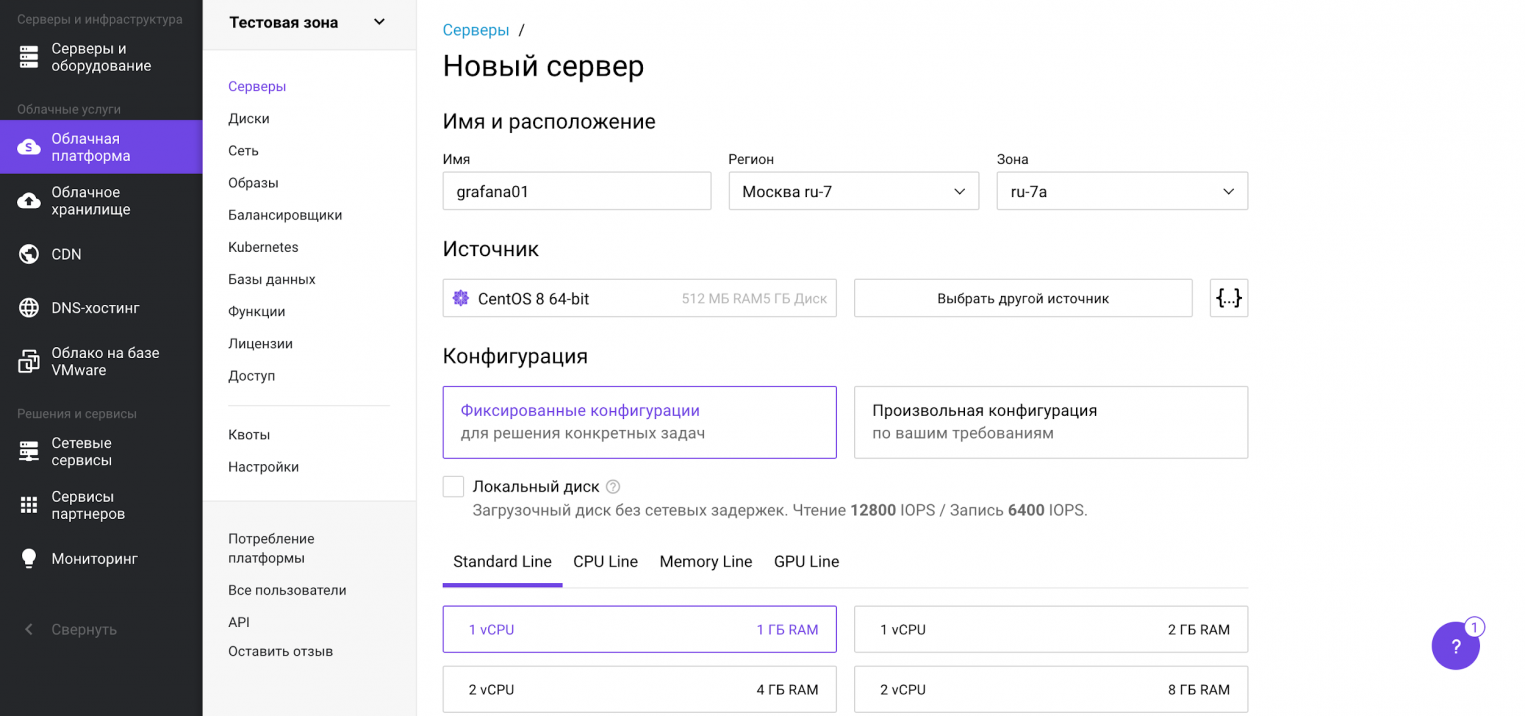
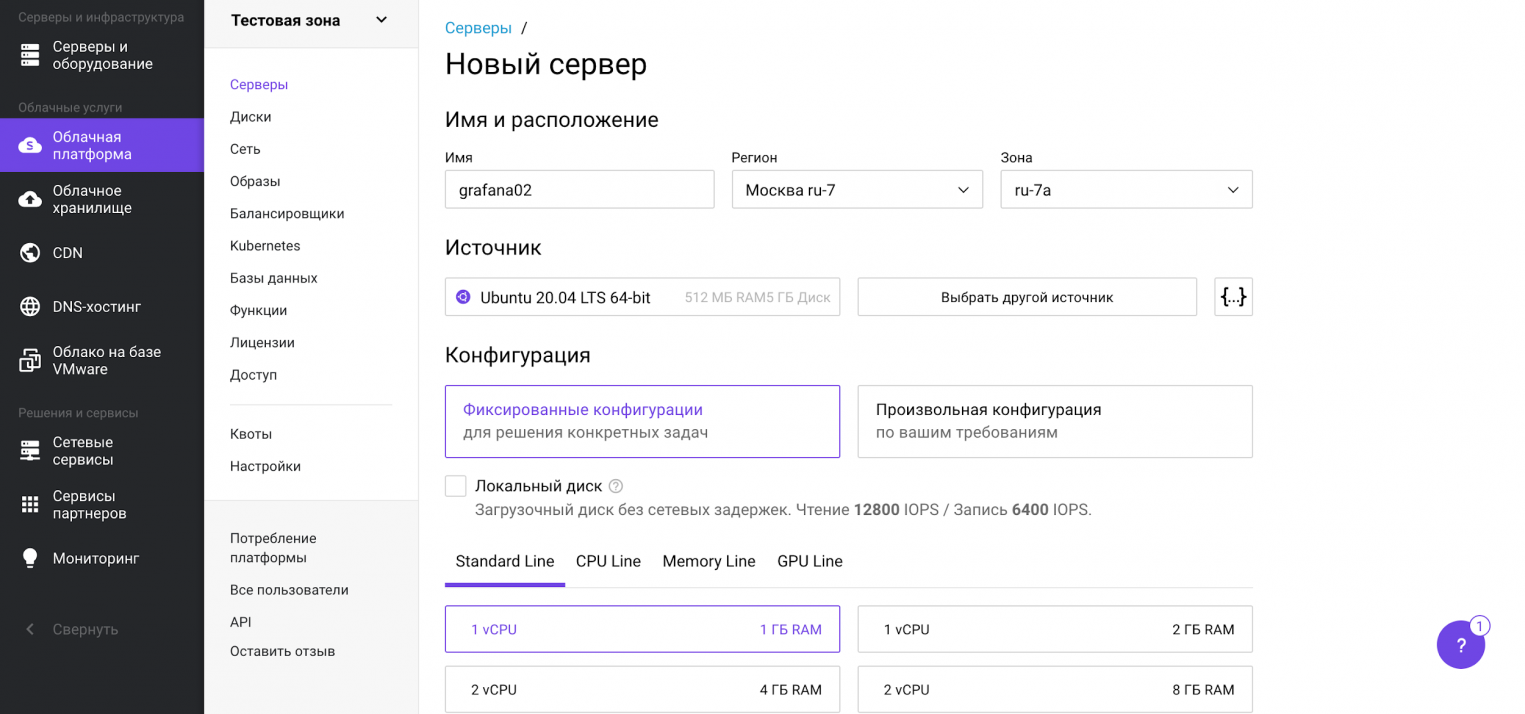
Our server will have 10 GB of hard disk space. For the purposes of the demonstration, this is sufficient. Scroll down and click the Create button. Similarly, we will create a server with Ubuntu 20.04 LTS 64-bit.
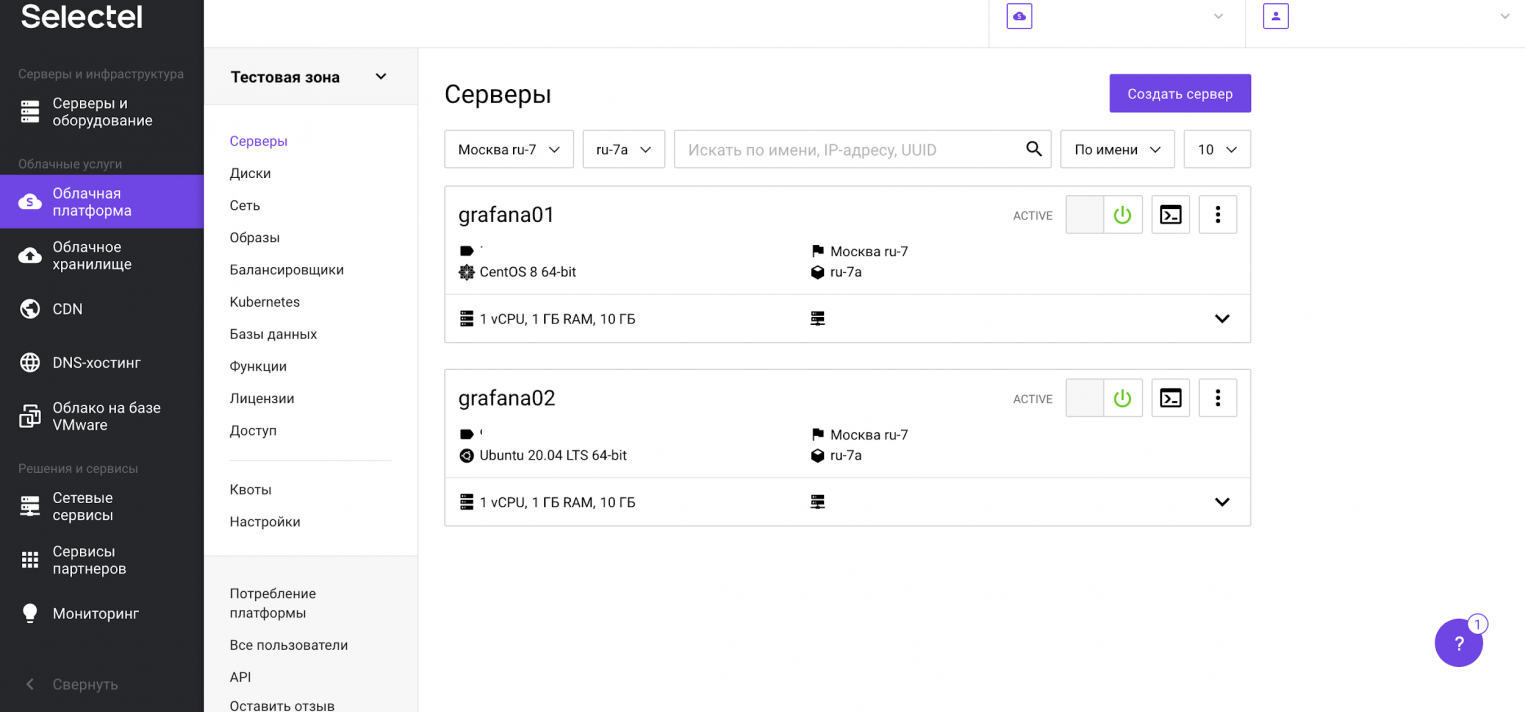
After the done manipulations, both servers will appear in the list of available ones. Let’s start installing Grafana.
- Installing Grafana on CentOS Stream
- Installing Grafana on Ubuntu 20
- Configuring a firewall to access Grafana
- Creating and customizing panels and dashboards
- Import and export dashboards
- Reverse proxy and SSL
- Grafana configuration file
- [paths]
- Logs
- [server]
- Protocol
- Domain
- Enforce_domain
- Root_url
- Static_root_path
- Cert_file
- Cert_key
- [database]
- Type
- Host
- User
- Password
- Ssl_mode
- [security]
- [users]
- Allow_org_create
- Auto_assign_org
- Auto_assign_org_role
- [auth. anonymous]
- Org_name
- [auth. ldap]
- Config_file
- [auth. proxy]
- Enabled
- Header_name
- Auto_sign_up
- [session]
- Provider_config
- Cookie_name
- Cookie_secure
- Session_life_time
- [analytics]
- [dashboards. json]
- Conclusion
- Set Up Grafana
- Docker Compose
- Permission Issues
- UPDATE
- Find User ID
- Manually Add the Zabbix Plugin
- Test Networking
- Back on track with Docker-Compose
- Configure Grafana
- Problem — No Data
Installing Grafana on CentOS Stream
sudo nano /etc/yum.repos.d/grafana.repo
Let’s write the following variables with values into this file:
Next, install Grafana:
sudo yum install grafana -y
After installation, enable autoload and start the Grafana daemon:
sudo systemctl enable grafana-server
sudo systemctl start grafana-server
Installation completed. Grafana on CentOS Stream is ready to use. Check the current status of the service:
sudo systemctl status grafana-server
As a result, we get the output:
grafana-server.service — Grafana instance
Loaded: loaded (/usr/lib/systemd/system/grafana-server.service; enabled; vendor preset: enabled)
Active: active (running) since Mon 2021-01-25 09:48:04 MSK; 5s ago
Installing Grafana on Ubuntu 20
On Ubuntu, Grafana is installed from the manufacturer’s repository. Download the GPG key and add it to the trusted list:
After that, add the Grafana repository to the system:
sudo add-apt-repository «deb https://packages.grafana.com/oss/deb stable main»
Next, update the APT cache and install Grafana:
sudo apt update
sudo apt install grafana
Installation completed. Grafana on Ubuntu 20.04 is ready to use. Check the current status of the service:
grafana-server.service — Grafana instance
Loaded: loaded (/usr/lib/systemd/system/grafana-server.service; enabled; vendor preset: enabled)
Active: active (running) since Mon 2021-01-25 09:44:26 MSK; 10s ago
Configuring a firewall to access Grafana
By default, Grafana is available on port 3000. When using firewalld or iptables, you must allow network access to this port from the outside world.
A set of commands for firewalld (adding a new rule and reloading the firewalld service to apply the configuration):
firewall-cmd —zone=public —add-port=3000/tcp —permanent
systemctl reload firewalld
Command set for iptables:
Enter the following line in the OUTPUT ACCEPT section:
-A INPUT -p tcp -m tcp —dport 3000 -m state —state NEW -j ACCEPT
And restart iptables:
sudo systemctl restart iptables
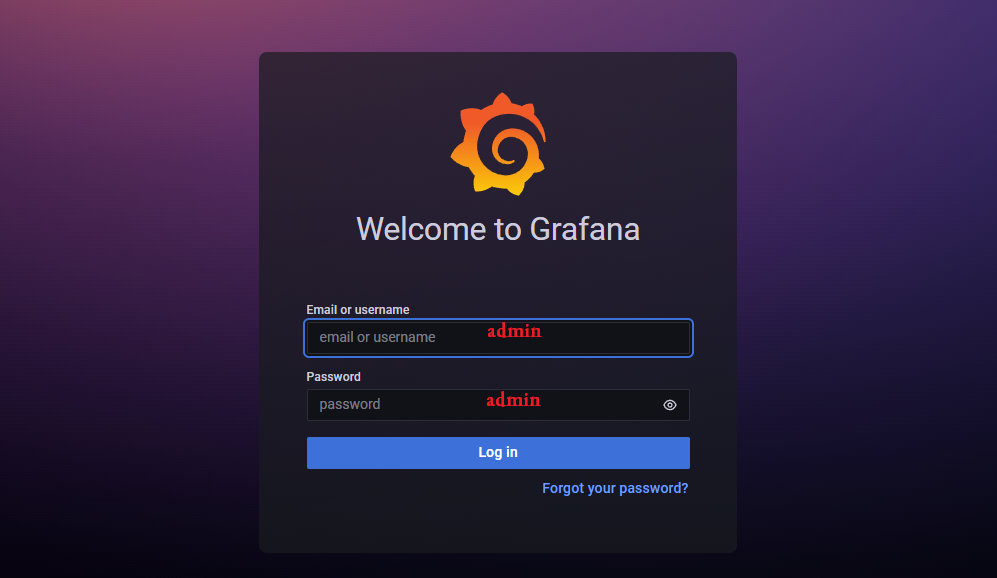
After executing the command above, you can log in with a new password.
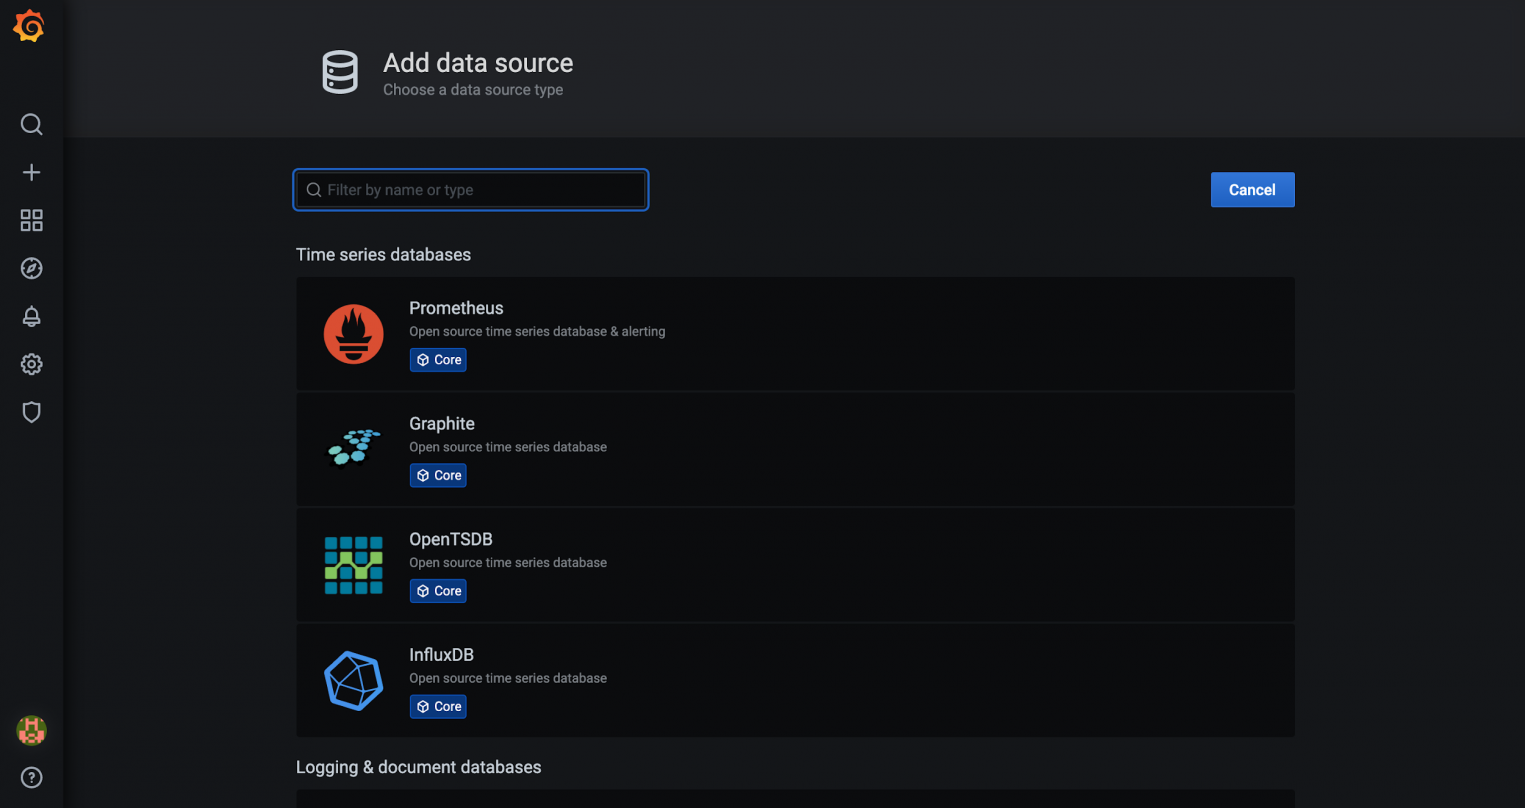
Grafana supports various data sources out of the box:
The full list can be found in the documentation. The list of built-in data sources can be extended using third-party plugins. One such plugin is the Zabbix plugin for Grafana. Monitoring is one of the main purposes of using Grafana.
Install this plugin and add it to Grafana.
grafana-cli plugins install alexanderzobnin-zabbix-app
Now let’s restart the Grafana service:
systemctl restart grafana-server
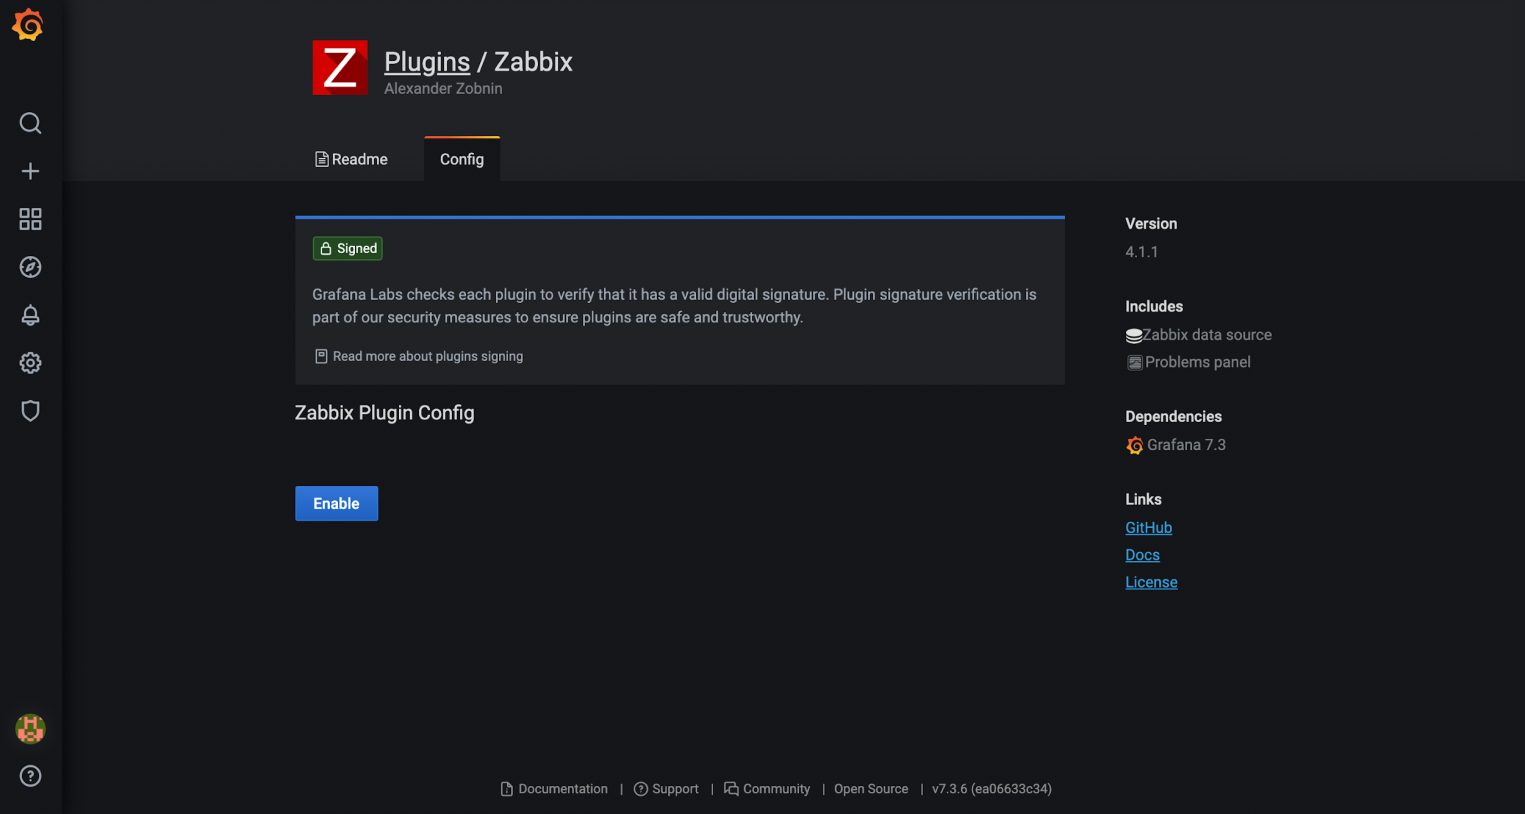
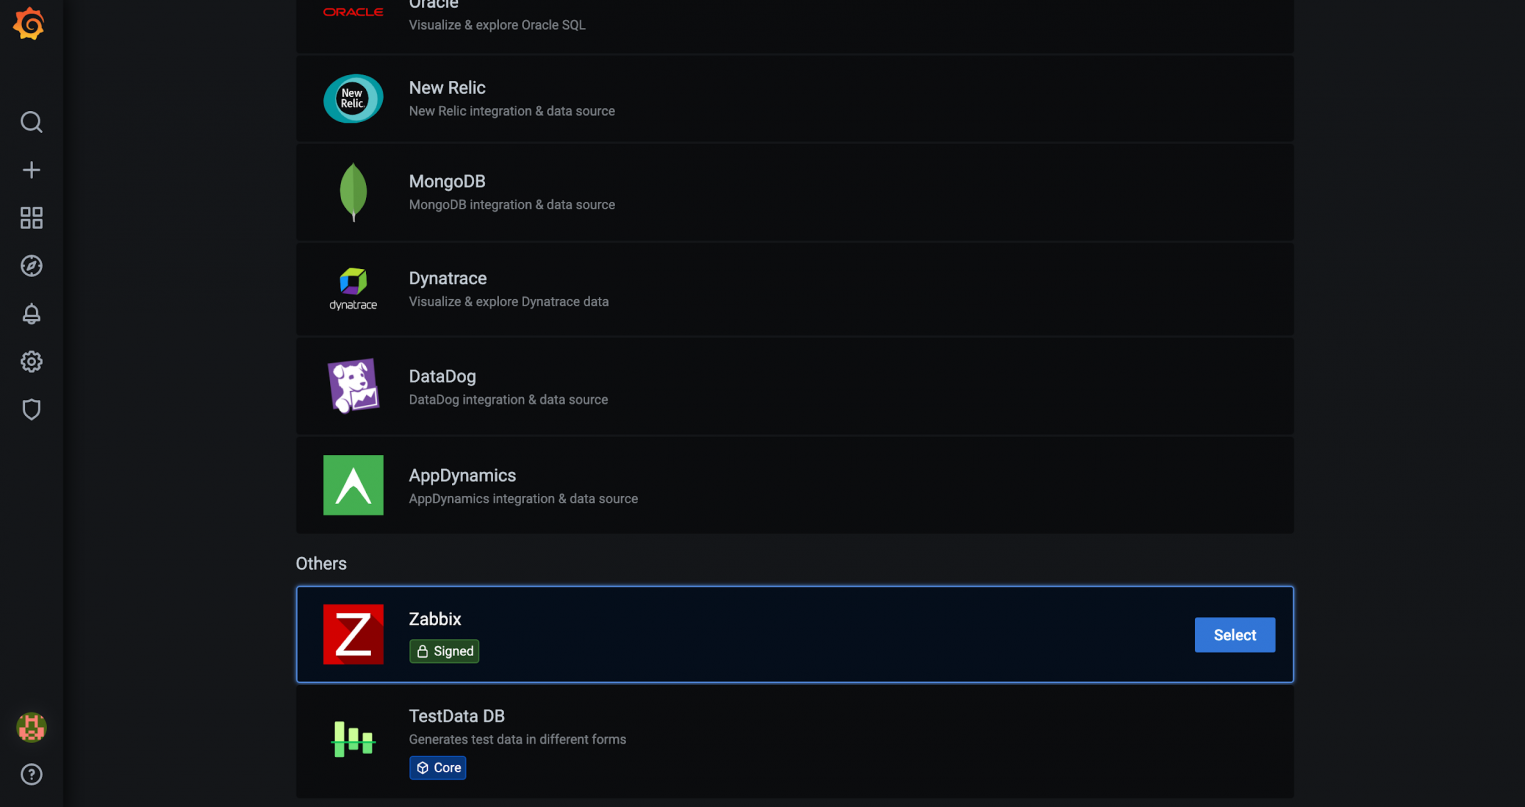
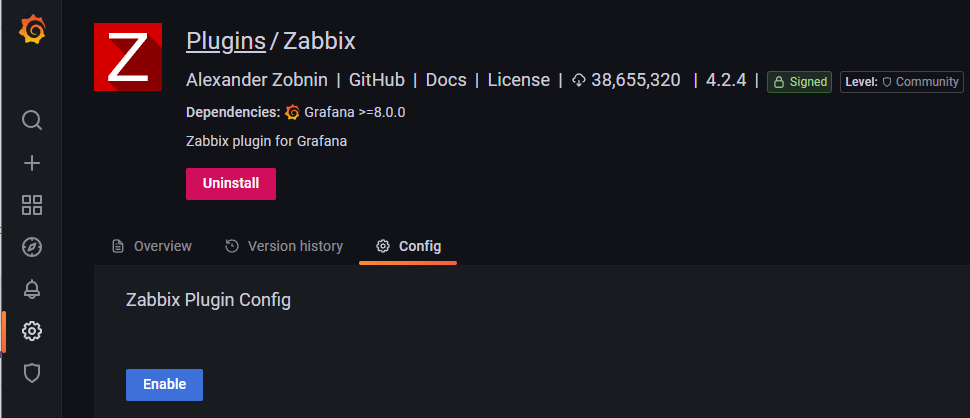
Let’s proceed to the plugin settings and click on the Enable button.
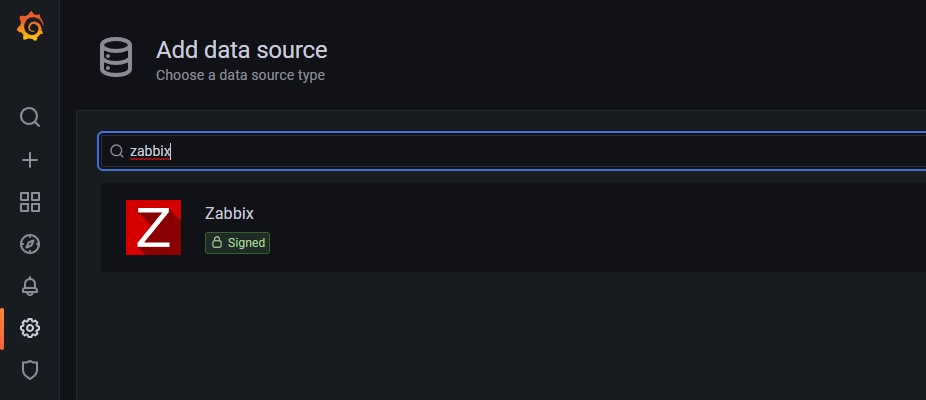
From the moment the plugin is enabled, a new data source will appear in the Data Sources menu — Zabbix. Click on the Select button and set up the data source.
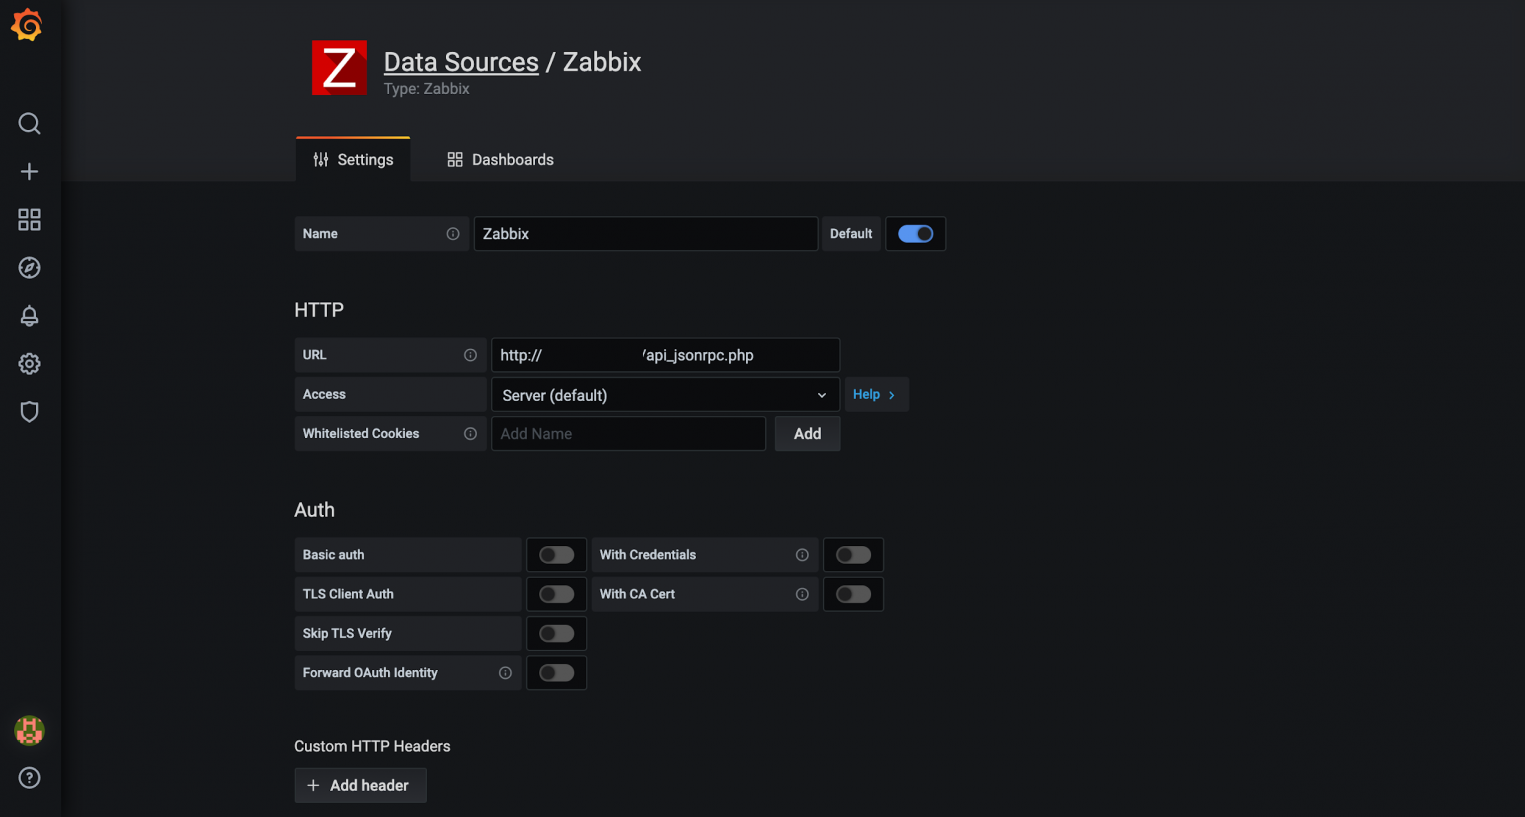
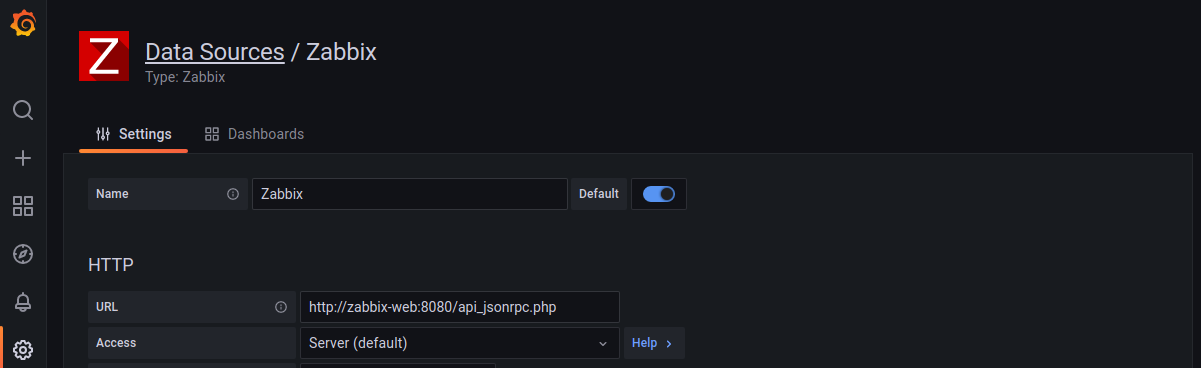
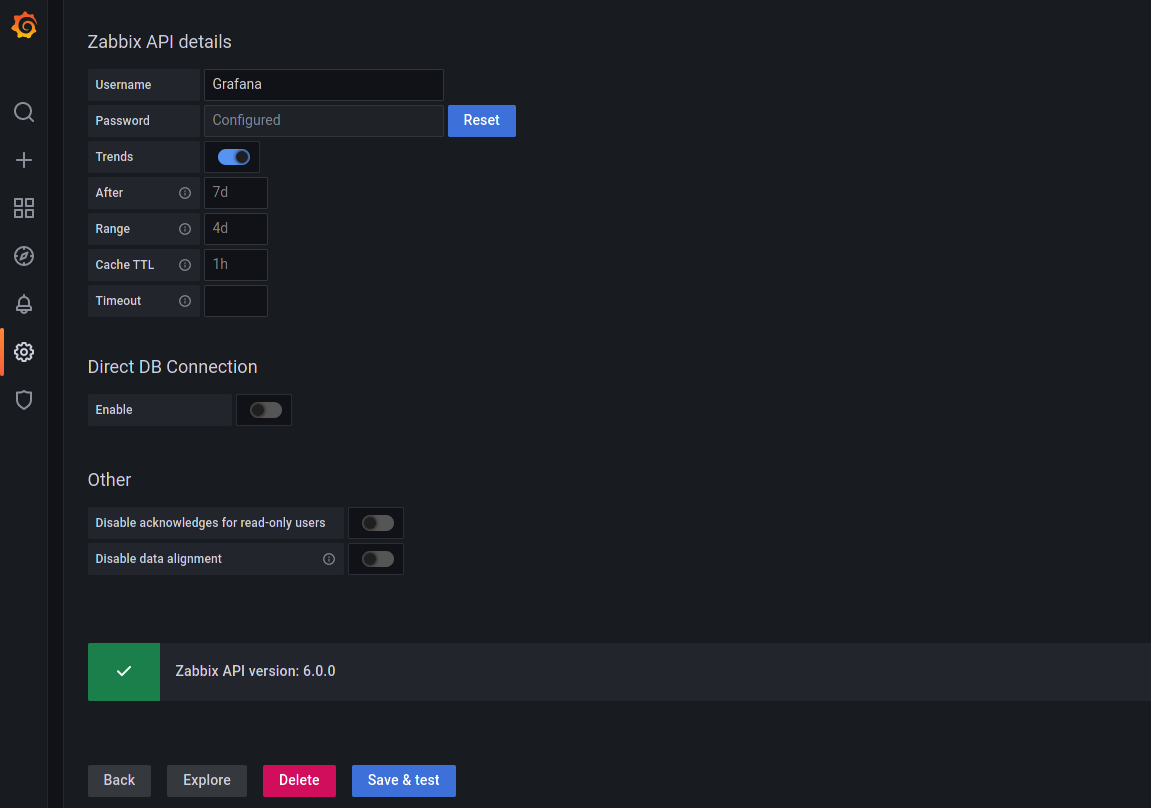
In the plugin settings, specify the URL, username and password for API access to Zabbix.
Press the Save & Test button and get confirmation of the correctness of the settings.
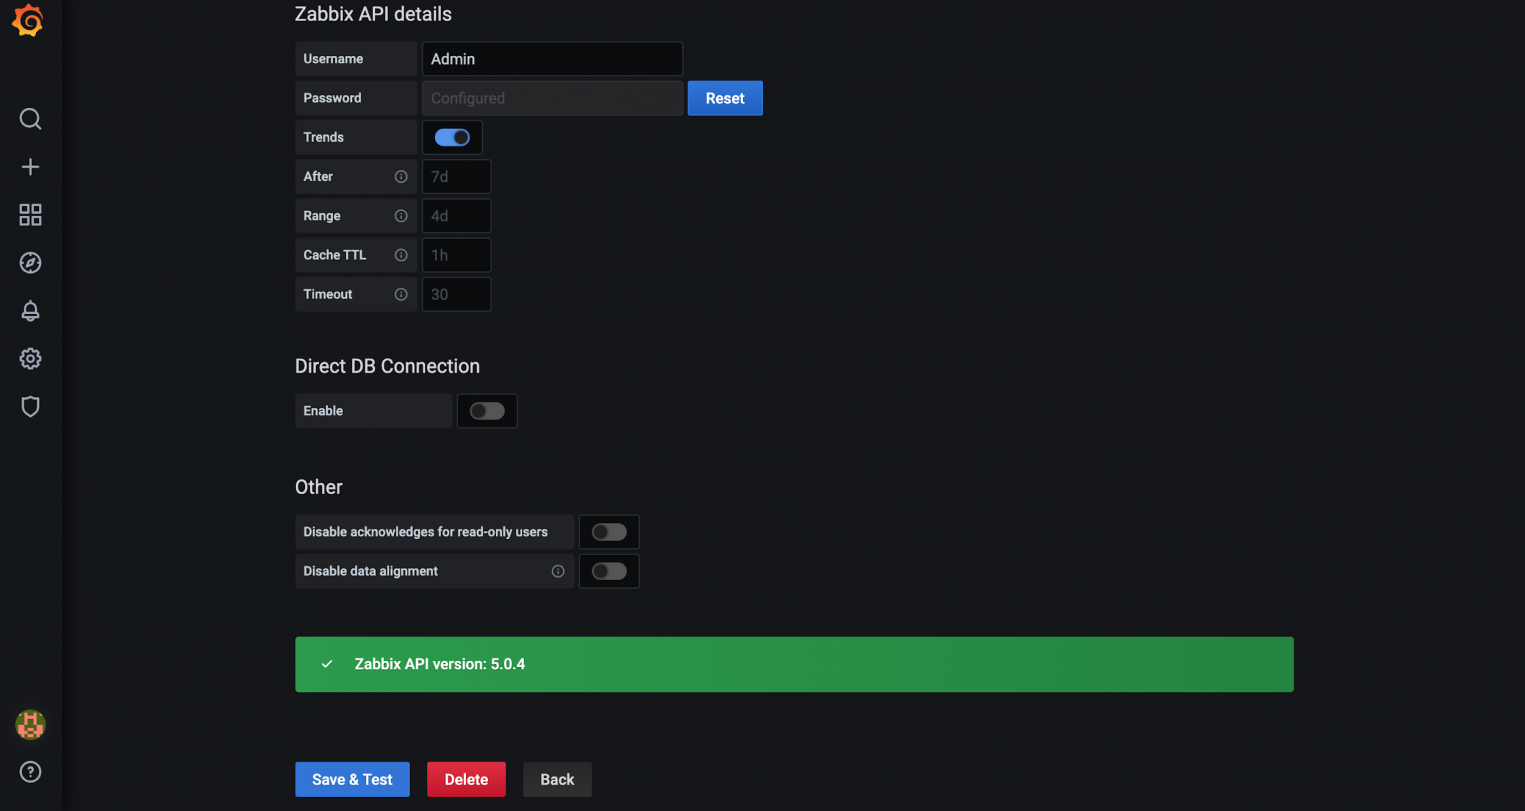
From now on, data from Zabbix can be used to create visualizations.
Creating and customizing panels and dashboards
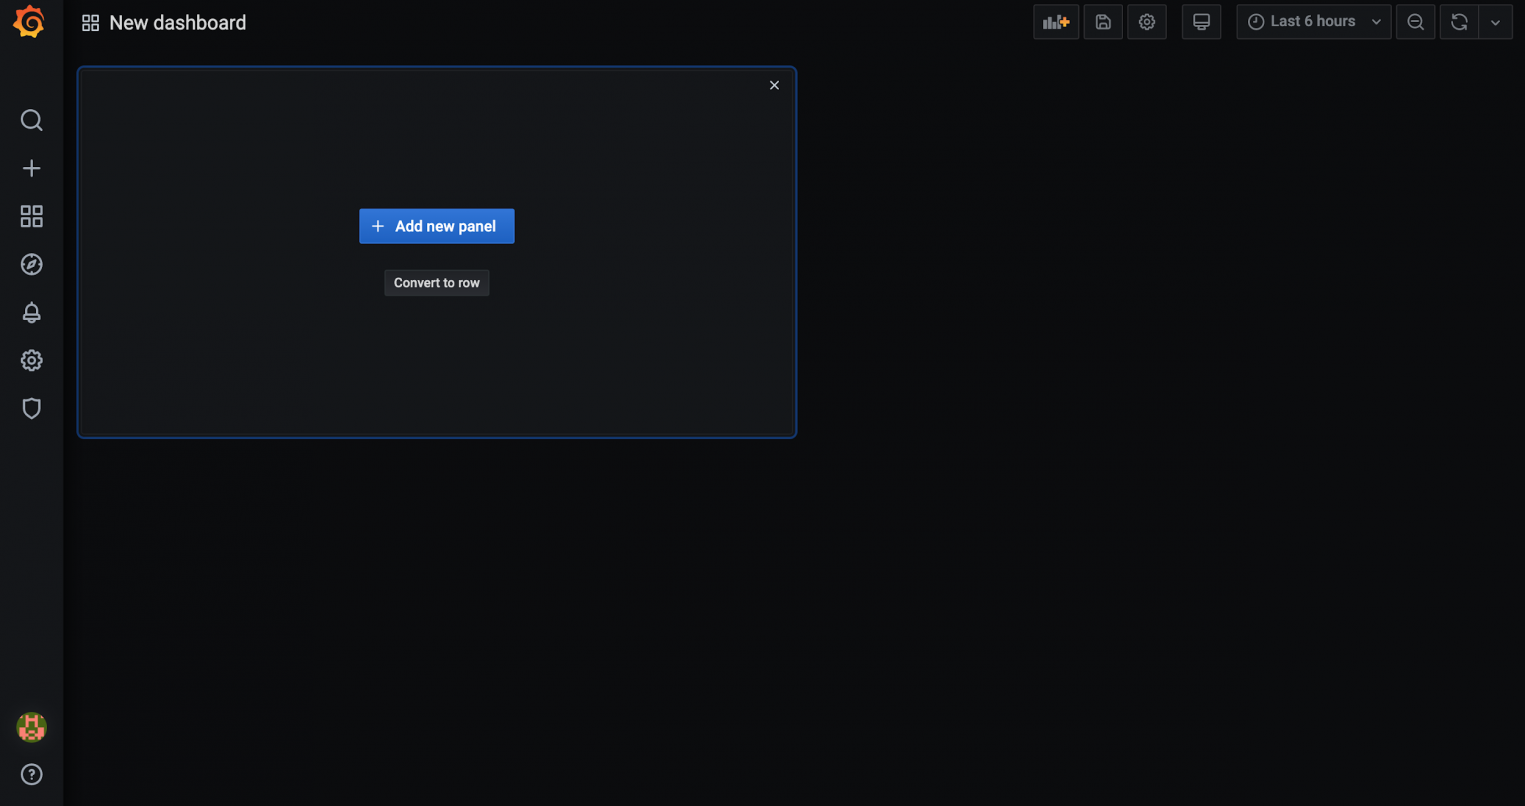
Panels and dashboards are the main view entities inside Grafana. Each dashboard consists of a set of panels. To create dashboards, go to the Dashboards view and click on the New Dashboard button.

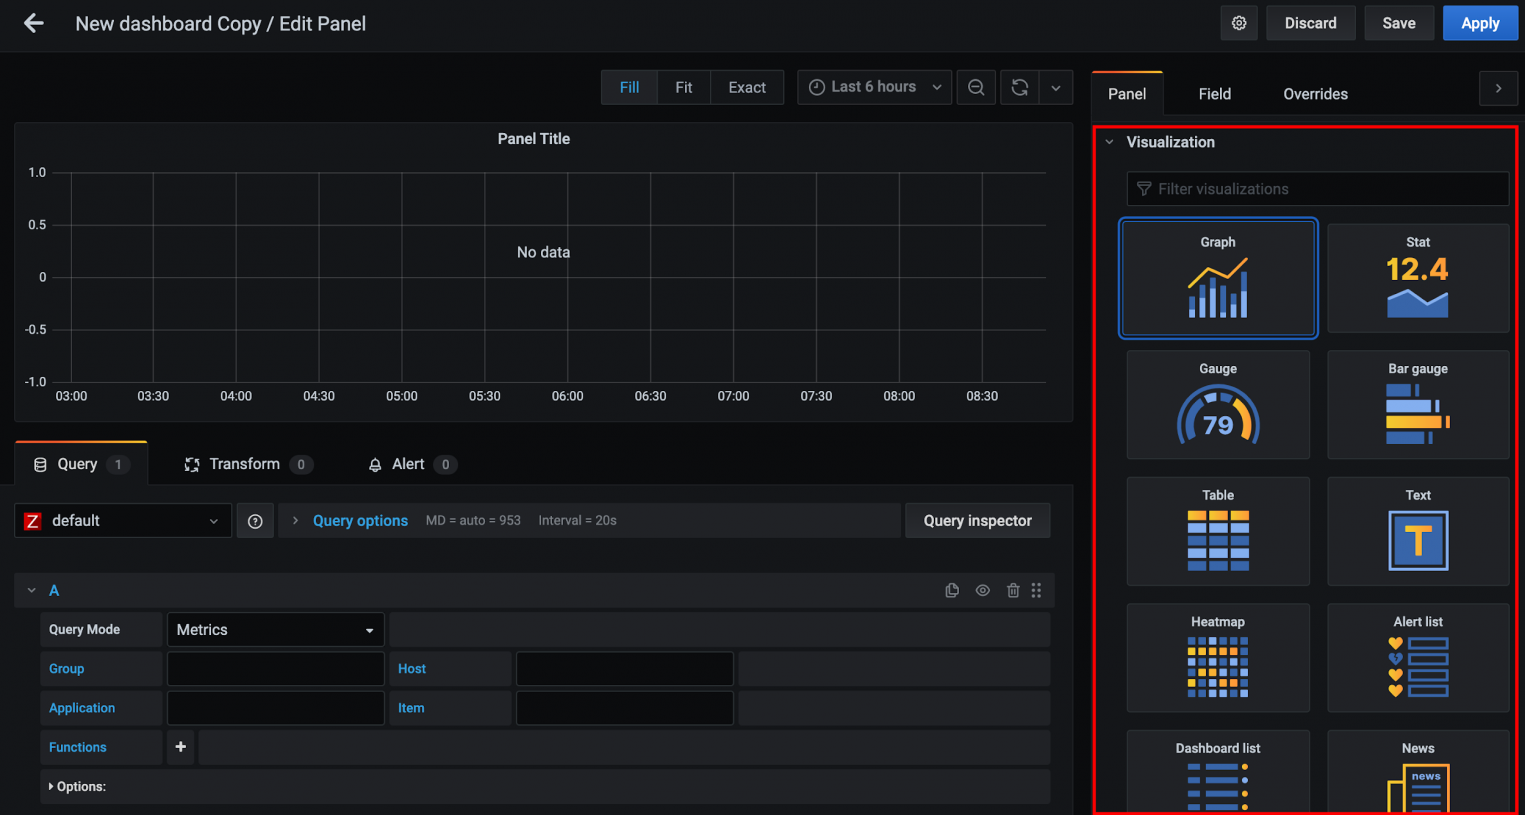
In the next step, you will be asked to add a new panel to the dashboard.
Grafana has built-in panels that you can start using right away. The default types are:
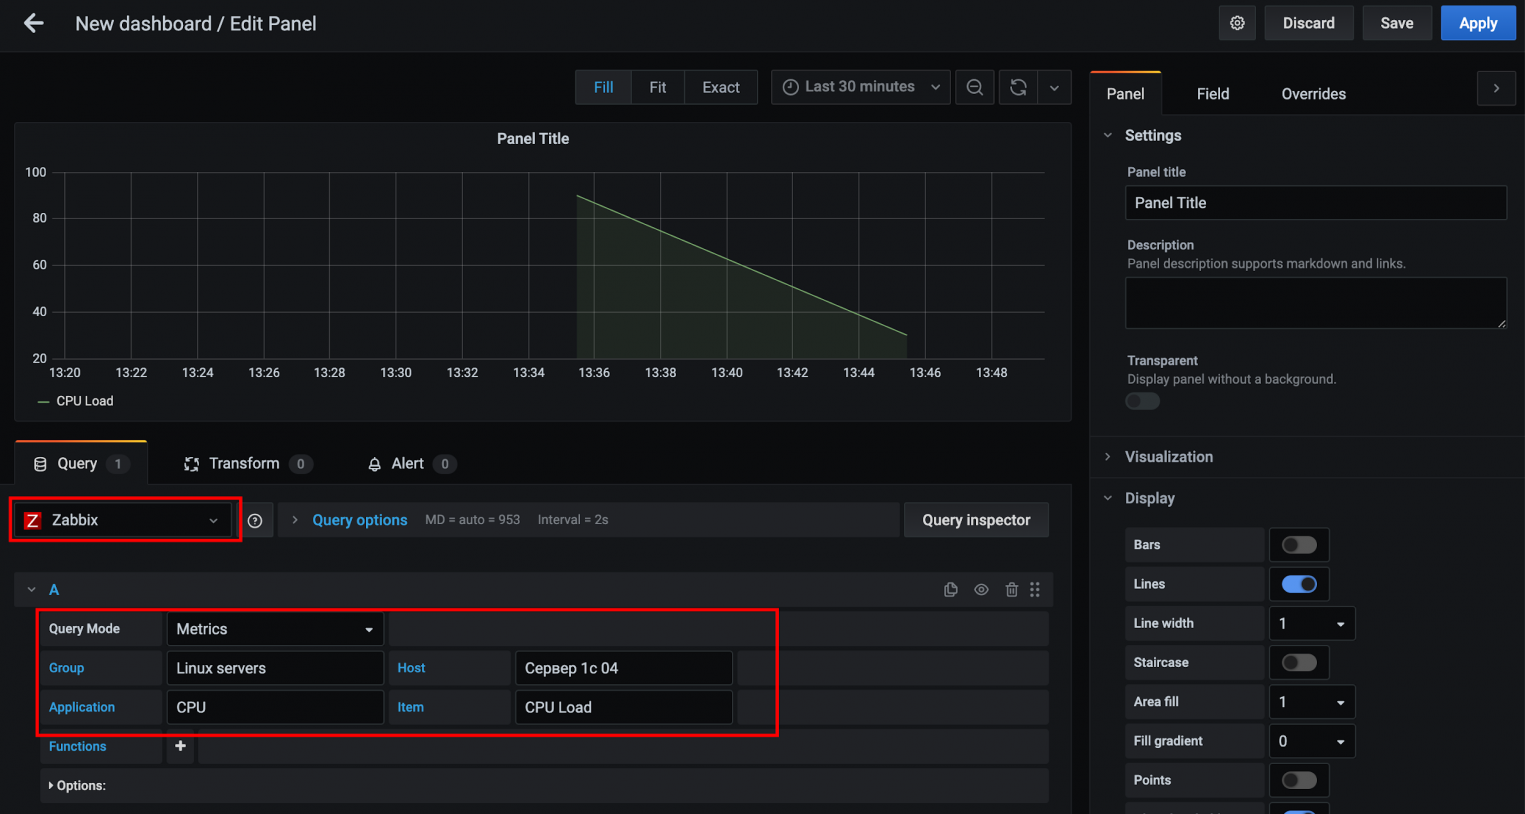
Next, select the Zabbix data source from the drop-down menu and specify the group, host, application, and item. If everything is done correctly, the data will appear on the chart.
Grafana supports various types of visualizations:
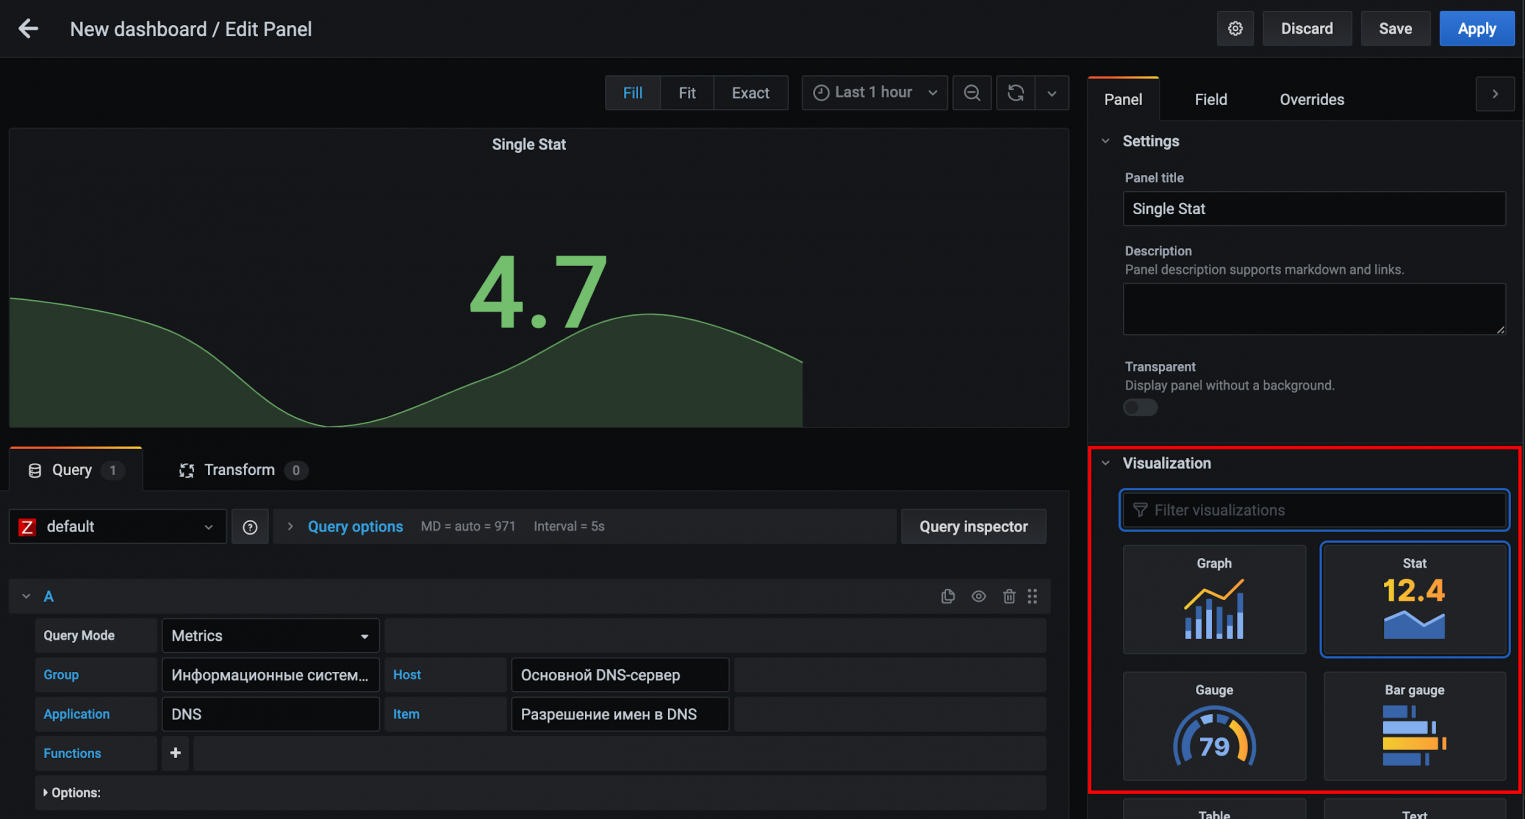
When creating a new panel, on the right side of the screen in the Visualization section, you can select the type of visualization. Let’s move on to creating SingleStat (displayed as Stat) — a panel with a combination of numerical and graphical representations. After entering specific data for Zabbix, click the Apply button.
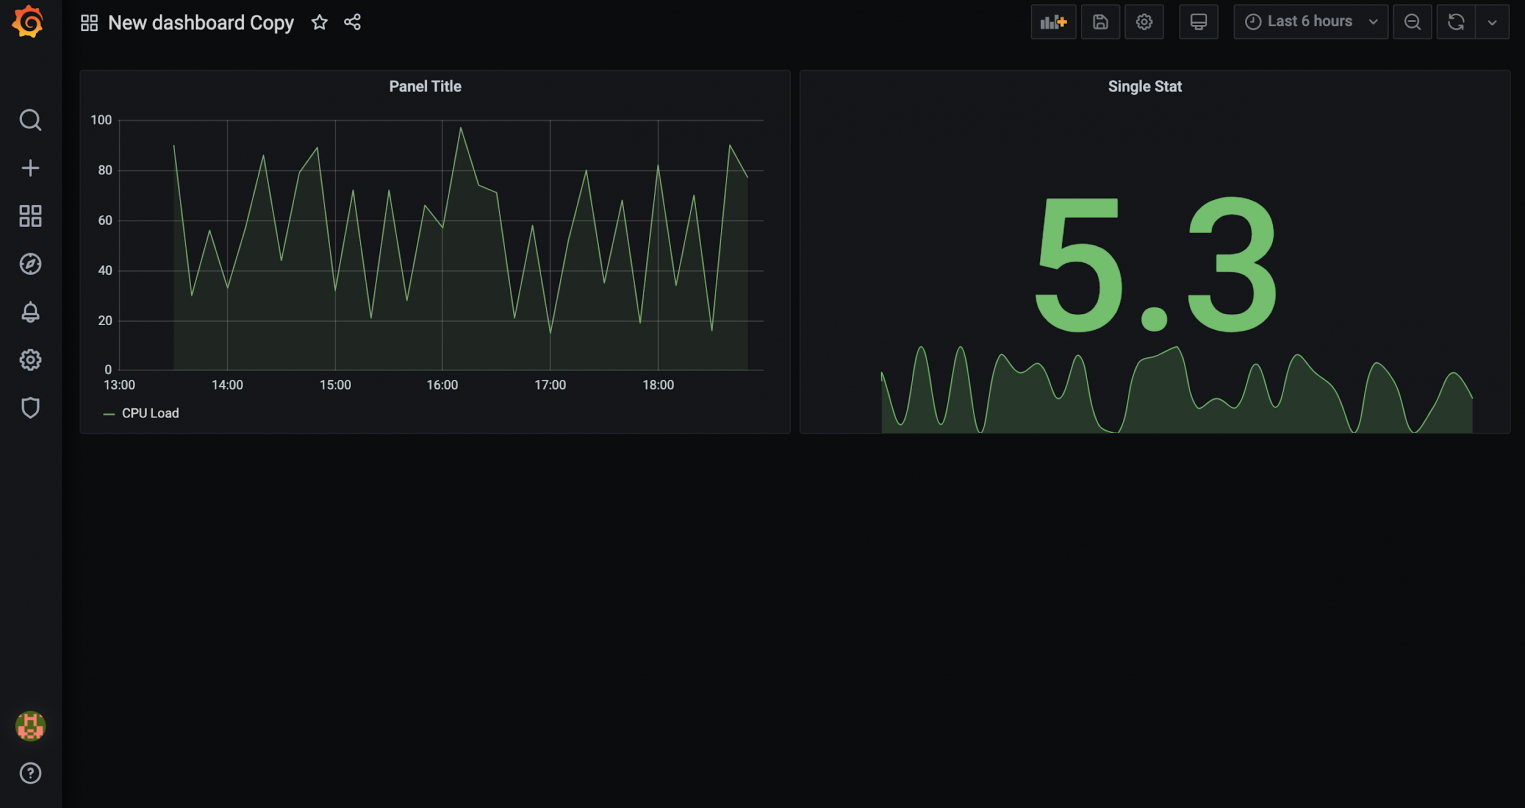
As a result of the performed actions, we will see two panels on the dashboard.
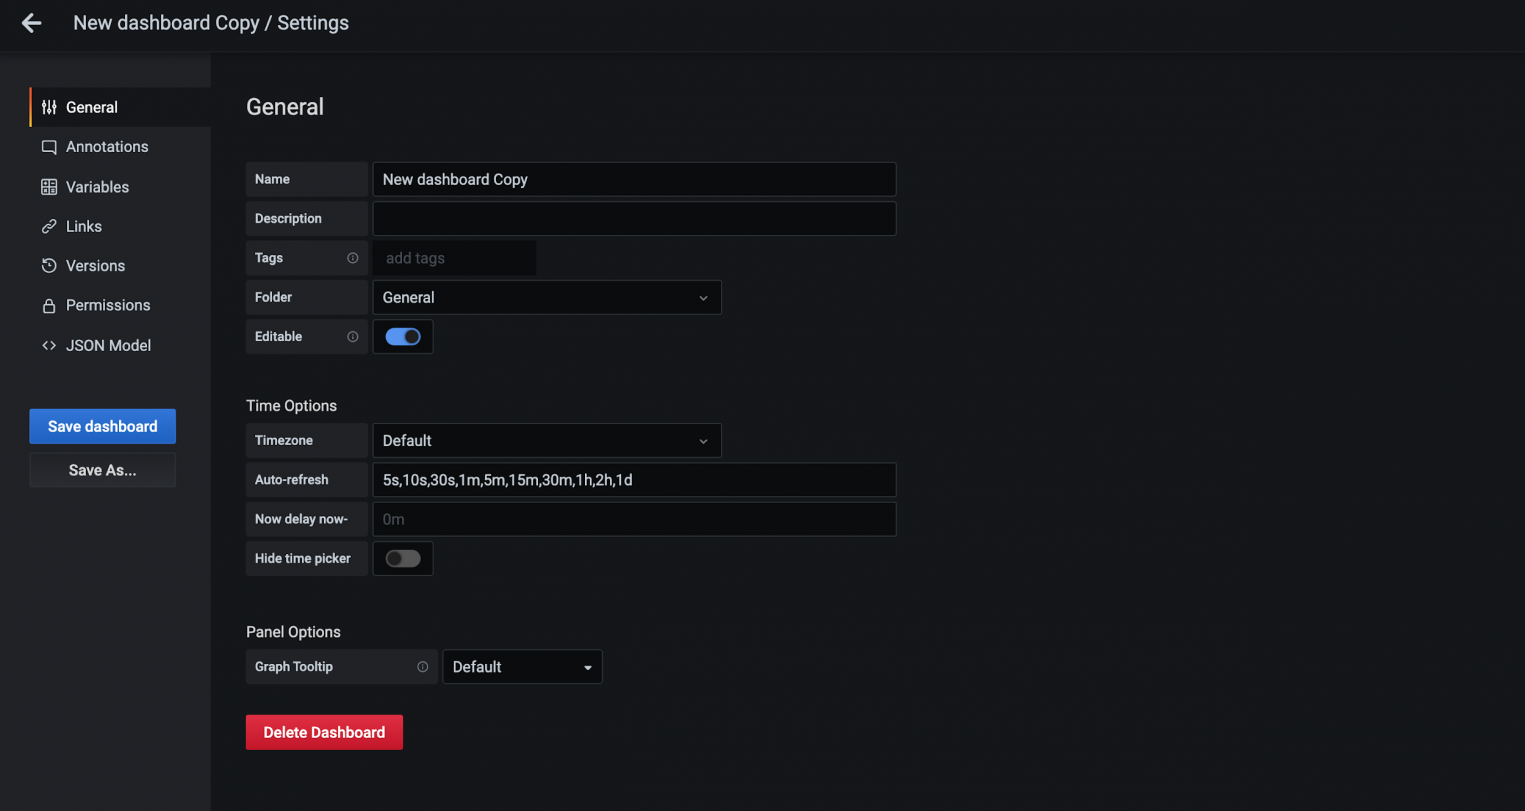
Each panel and each dashboard in Grafana has its own set of settings. The settings of the first one are opened through the drop-down menu of the panel, and the settings of the second one will be opened after clicking on the gear in the upper right corner of the screen.
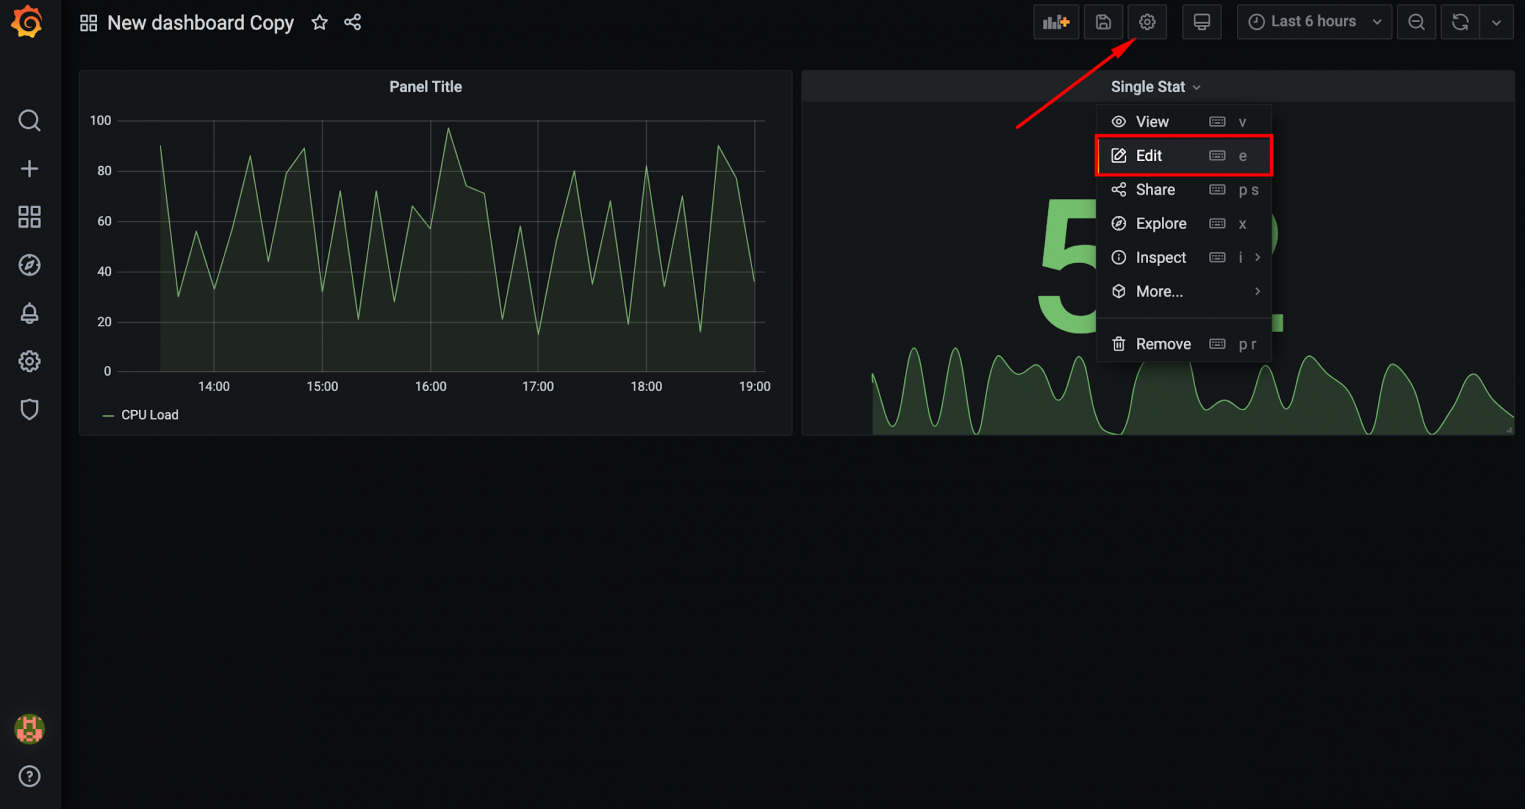
The image below shows the dashboard settings.
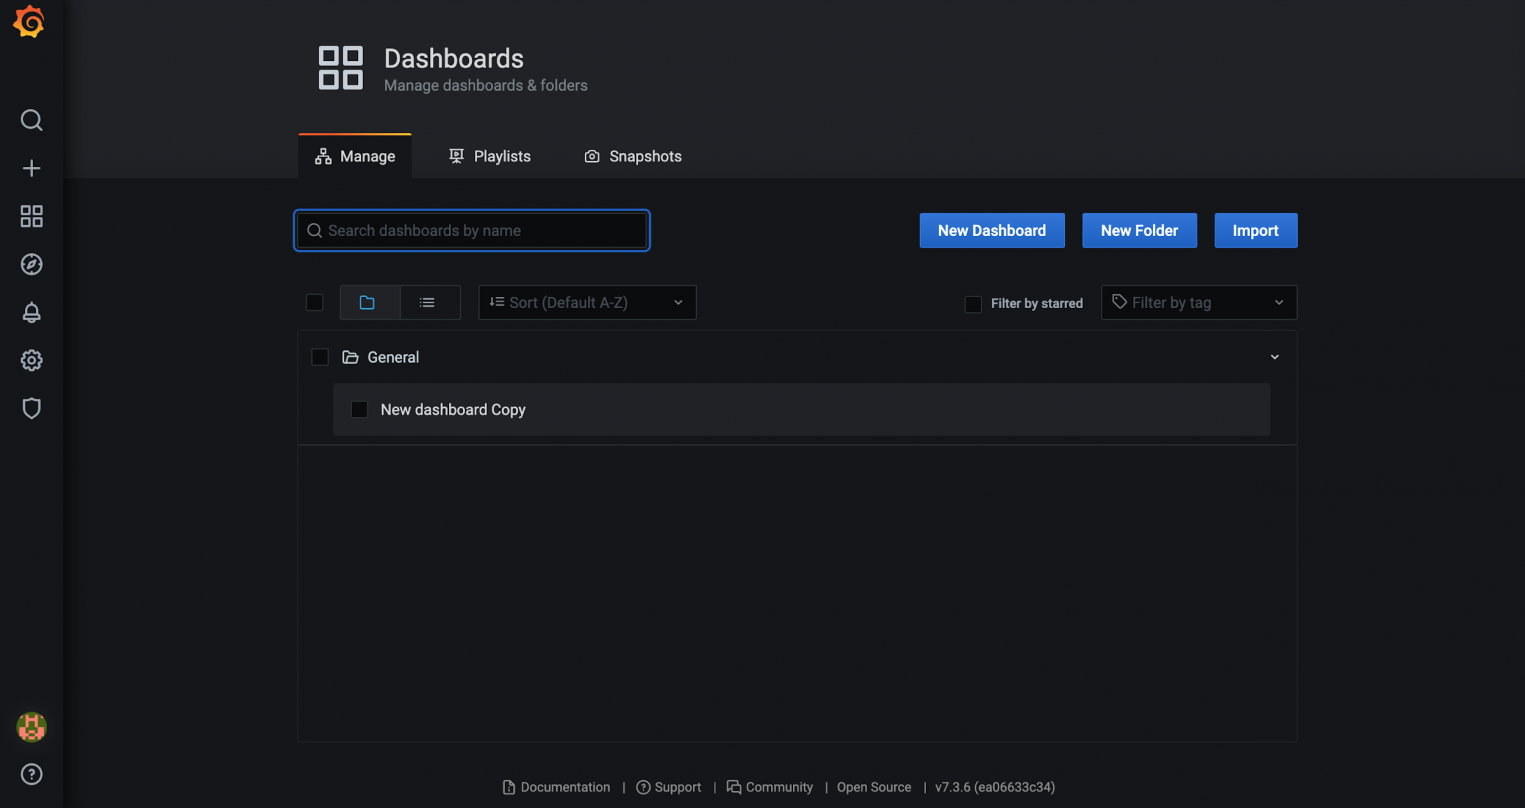
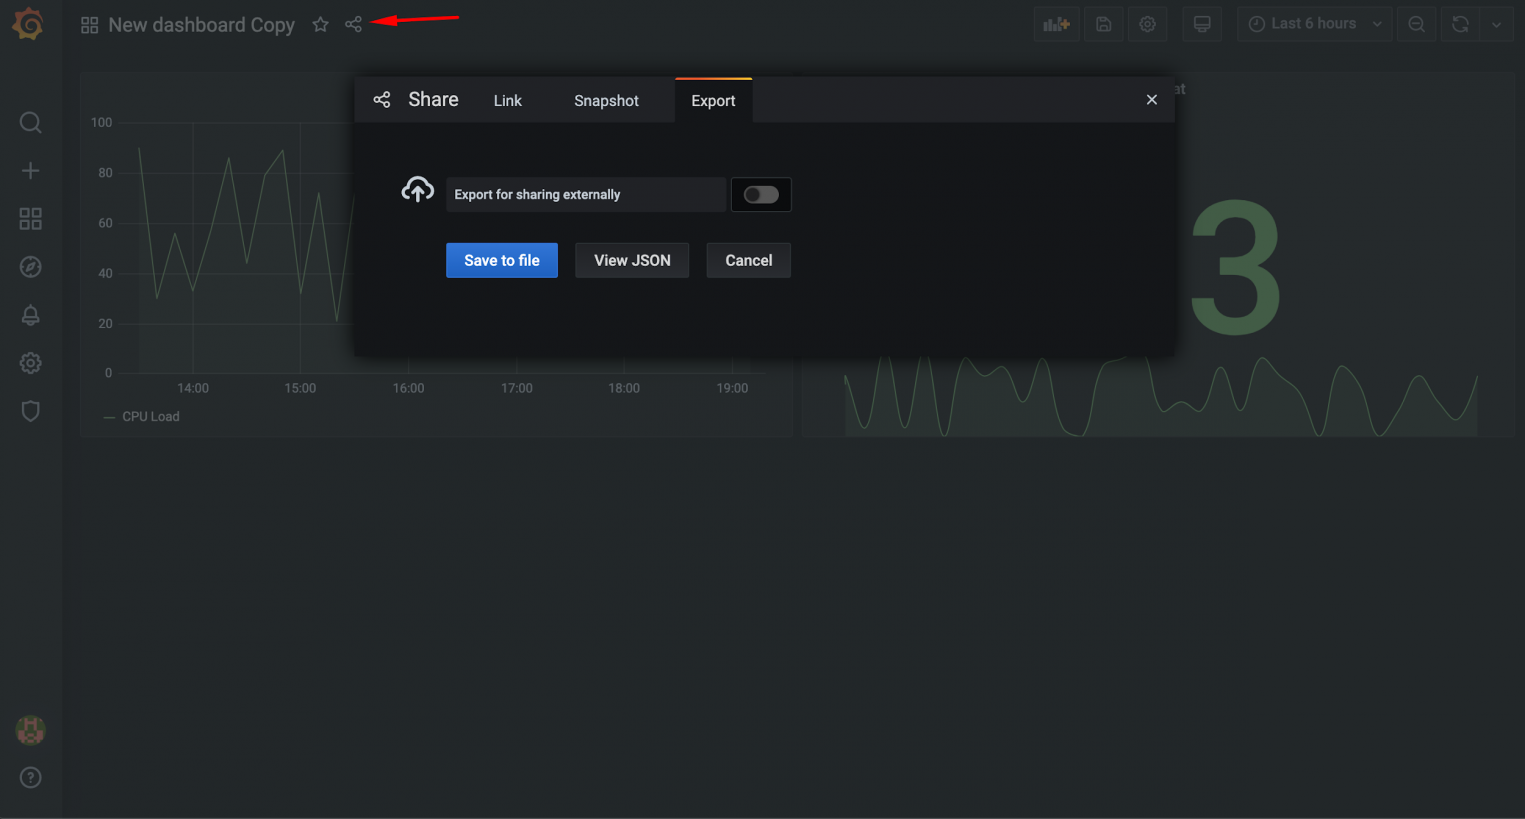
Import and export dashboards
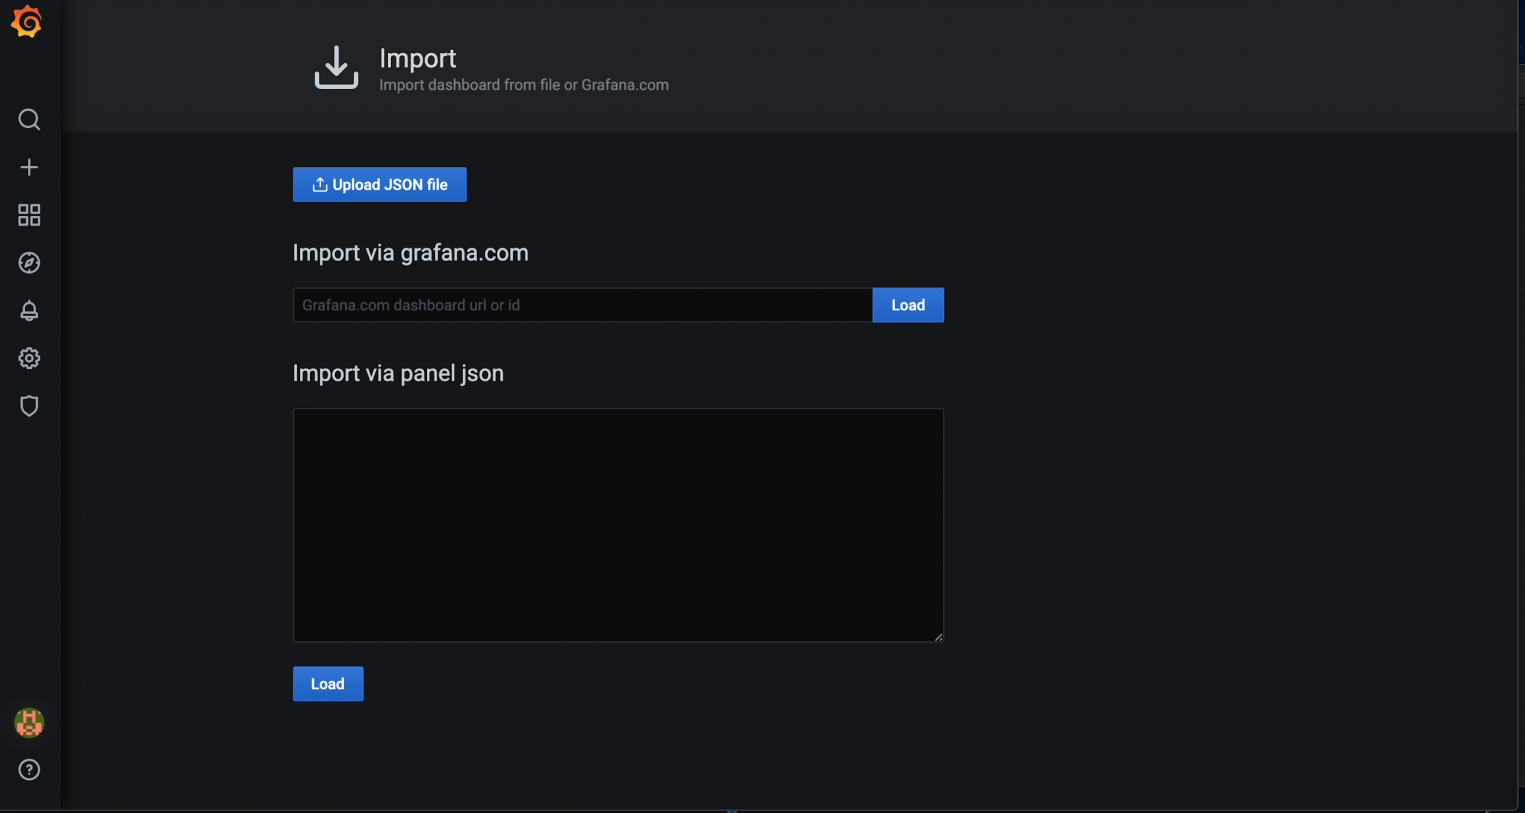
Grafana allows you to import and export dashboards. To import, go to the Dashboards view and click the Import button.
Two options are available for import: loading custom JSON and importing ready-made dashboards from grafana.com. In the second case, you need to specify the dashboard ID.
To export any dashboard, you need to click on the special icon at the top of the screen and then click Save to file. The dashboard will be saved in JSON format.
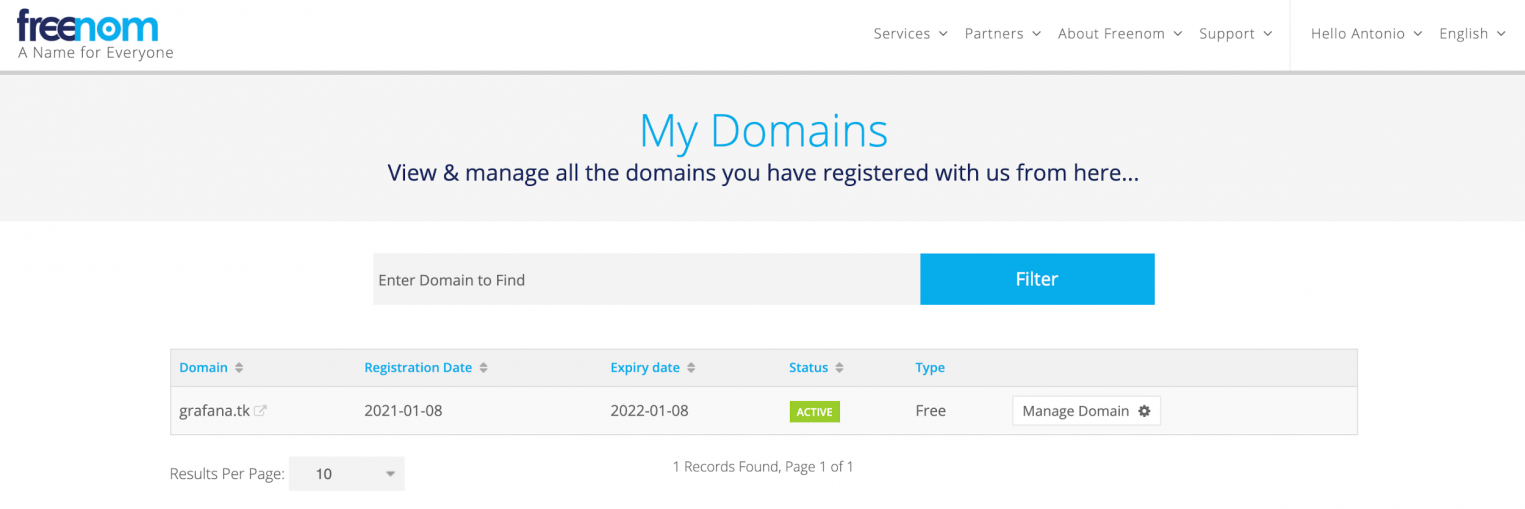
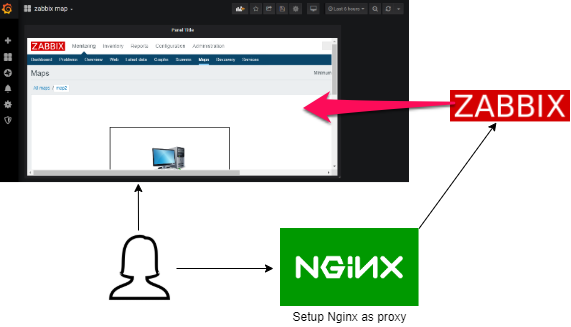
Reverse proxy and SSL
To set up SSL in Grafana, you need to use a reverse proxy server. In this section, we will describe how to configure such an Nginx-based proxy. For demonstration purposes, we registered the grafana.tk domain, for which we issued a special Let’s Encrypt certificate.
After creating the server, we configured the Nginx web server to work over SSL. It remains to redirect traffic from it to port 3000, on which Grafana is available. To do this, open the web server configuration file.
sudo nano /etc/nginx/sites-available/grafana.tk
In this file we will work with this configuration block:
Let’s replace it with the following:
Thus, we have configured forwarding to the local port 3000. Now you can check the correctness of the Nginx configuration:
sudo nginx -t
Restart Nginx:
sudo systemctl reload nginx
Our test Grafana is now available at https://grafana.tk. Let’s check:
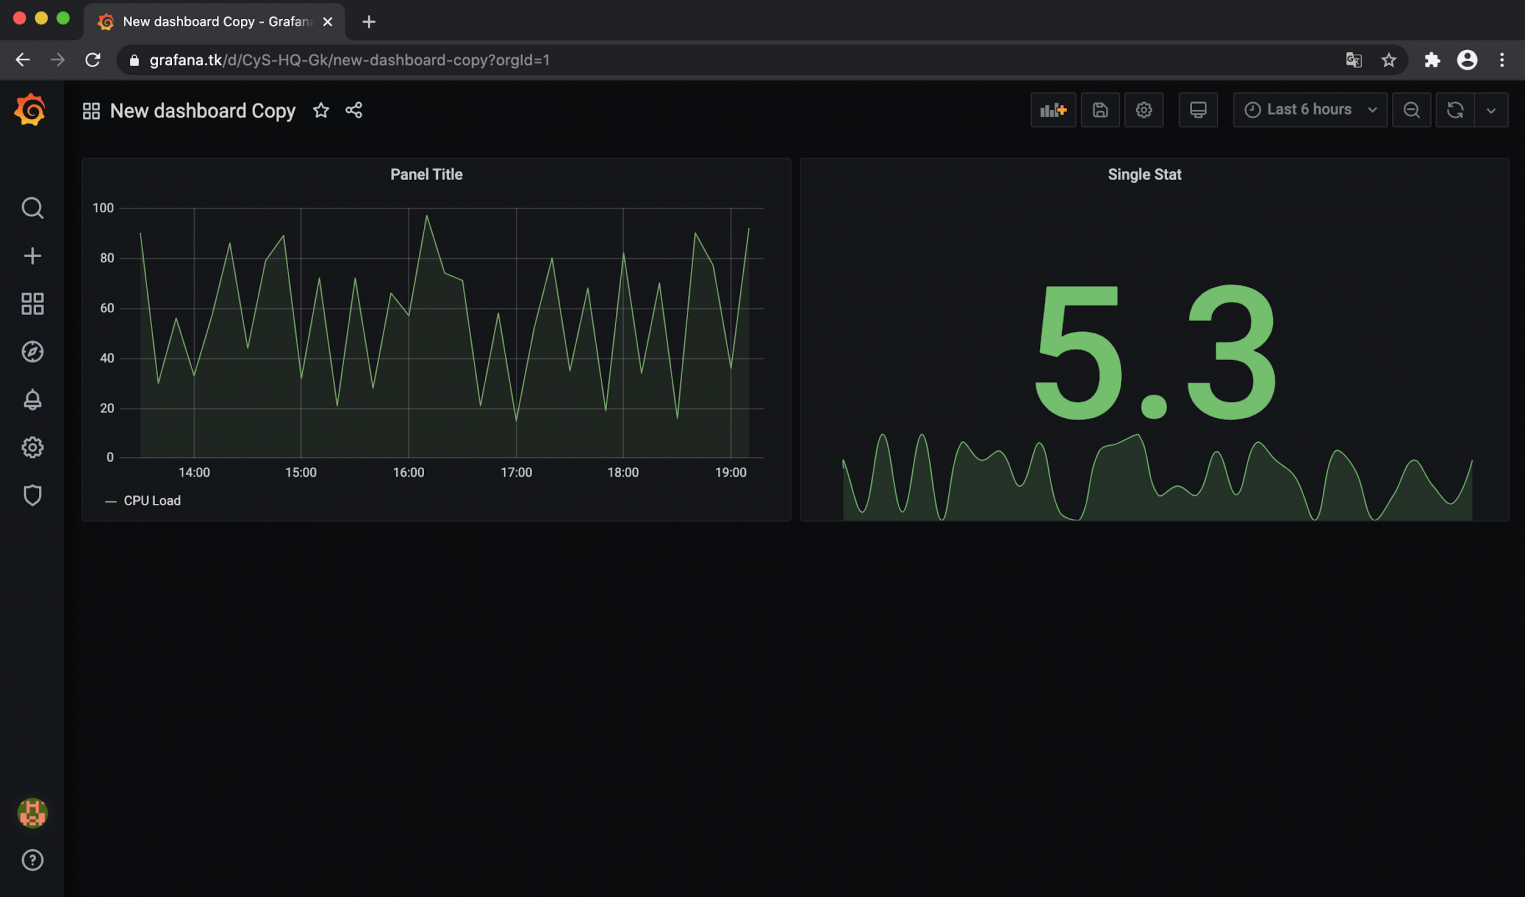
In addition to the SSL settings, in Grafana, to increase the level of security, you can disable anonymous access and the creation of new accounts.
Grafana configuration file
To fine-tune Grafana, you can use the configuration file (by default /etc/grafana/grafana.ini). Here are stored parameters that can be changed if necessary. Consider the main blocks of this file.
[paths]
Directory where Grafana stores the sqlite3 database and other data. This directory is usually set in the init.d start script.
Logs
Directory where Grafana stores logs. This directory is usually set in the init.d start script.
[server]
The port where the Grafana web interface will be available. The default port number is 3000. If you want to use port 80, you can set up forwarding in iptables:
sudo iptables -t nat -A PREROUTING -p tcp —dport 80 -j REDIRECT —to-port 3000
You can also use the Nginx or Apache web server for redirects.
Protocol
The protocol by which Grafana will be available. http or https options.
Domain
Can only be used in conjunction with the root_url option (see below). Important if you are using GitHub or Google OAuth authentication.
Enforce_domain
Redirect to the correct domain if the host header does not match the domain. Default is false.
Root_url
Full URL to access Grafana through a web browser. Important if you are using GitHub or Google OAuth authentication.
Static_root_path
Path to the directory where the HTML, JS and CSS files are located.
Cert_file
Directory with certificate file (if access to Grafana is https).
Cert_key
Directory with the key file (if Grafana is accessed via the https protocol).
[database]
Grafana needs a database to store users, dashboards and other data. The default is sqlite3, which is included with the Grafana distribution.
Type
Mysql, postgres or sqlite3 are supported to choose from.
The parameter is only applicable to the sqlite3 database. The path to the data file.
Host
Grafana database name.
User
Database username (not applicable to sqlite3).
Password
Database user password (not applicable to sqlite3).
Ssl_mode
Applies to postgres only. The available options are disable, require, or verify-full.
[security]
Disable user icon. Set to true to disable. The default is false.
[users]
Set to false to prevent existing users from creating new accounts.
Allow_org_create
Set to false to prevent existing users from creating new organizations. The default value is true.
Auto_assign_org
Set to true to automatically add new users to the main organization (id 1). When set to false, new users are added to new organizations that are automatically created.
Auto_assign_org_role
The role of new users will be tied to the main organization.
[auth. anonymous]
Set to true to enable anonymous access. Default is false
Org_name
Sets the organization name to be used for anonymous users.
When set to true (default) the http api will accept connections with the basic authentication flag.
[auth. ldap]
Set to true to enable LDAP integration (default: false).
Config_file
Path to the LDAP configuration file (default: /etc/grafana/ldap.toml).
[auth. proxy]
This feature allows you to authenticate with the reverse proxy.
Enabled
Default is false.
Header_name
Default is a username, but can also be an email address.
Auto_sign_up
Set to true to enable automatic login for users who are not in Grafana DB. The default is set to true.
[session]
Valid values: memory, file, mysql, postgres. The default value is file.
Provider_config
This option must be configured separately depending on which session provider type is set.
Cookie_name
Grafana session cookie name.
Cookie_secure
Set to true if Grafana is only behind an HTTPS proxy. The default is set to false.
Session_life_time
How long the session lasts in seconds. The default is 86400 seconds (24 hours).
[analytics]
If you want to track Grafana activity using Google analytics, please provide your Universal Analytics ID. This feature is disabled by default.
[dashboards. json]
If you have a system that automatically builds dashboards from JSON files, you can enable this option to make new dashboards searchable in Grafana.
True or false value. Disabled by default.
Full path to the directory containing JSON files with dashboards.
Conclusion
We looked at approaches to installing, configuring and working with Grafana. This popular tool has a large community of developers who support the project and develop new plugins, dashboards and product development. Grafana has regular updates and improvements, so you can safely use this tool in production environments.

Set Up Grafana
To install Grafana directly run:
run -d —name
We now have to add the Zabbix plugin using the Grafana CLI:
‘grafana-cli plugins install alexanderzobnin-zabbix-app’ ‘grafana-cli plugins ls’
I just realized that the restart part is not going to work. You will have to mount a volume into the container where the plugins are stored to persist them -v /my/dir:/var/lib/grafana.
run -d —name:3000 -v /opt/grafana-compose/grafana:/var/lib/grafana grafana/grafana-oss:latest
I did not run this — you probably have to check folder permissions for the volume mount — docker-compose below. But let’s go straight to Docker-Compose and add the Grafana instructions to our compose file.
Docker Compose
Note: I am embedding this into my compose file for the Zabbix Server (see full file below )
Permission Issues
‘t create directory »: Permission denied’ is not writable. You may have issues with file permissions, more information here: http://docs.grafana.org/installation/docker/#migrate-to-v51-or-latert create directory
UPDATE
Migrate to v7.3 or later
The Grafana Docker image runs with the root group (id 0) instead of the grafana group (id 472), for better compatibility with OpenShift. If you extend the official Docker image you may need to change your scripts to use the root group instead of grafana.
Find User ID
-ti grafana /bin/ash grafana root root root grafana root grafana root grafana root grafana root grafana root
Manually Add the Zabbix Plugin
Now we can add the volume mounts and see if the container runs without issues:
I can now manually add the Zabbix plugin using the Grafana CLI:
‘grafana-cli plugins install alexanderzobnin-zabbix-app’✔ Downloaded alexanderzobnin-zabbix-app v4.2.4 ‘grafana-cli plugins ls’
Ok — this worked. Now stop the container and restart it using the backend and ingress network:
Test Networking
NETWORK ID NAME DRIVER SCOPEa77ffbc59dd5 bridge bridge 23e217540a23 ingress_gateway bridge 019b12ab4063 none null cb89d1ef4ff9 zabbix-server-compose_zbx_net_backend bridge f0affabc4e0a zabbix-server-compose_zbx_net_frontend bridge
network connect ingress_gateway grafana
Check if all containers are connected:
network inspect ingress_gateway
docker network inspect zabbix-server-compose_zbx_net_backend
Back on track with Docker-Compose
Delete the installed content in /opt/grafana-compose/grafana/lib, wrap everything into a single neat compose file and re-run it in docker-compose:
Configure Grafana
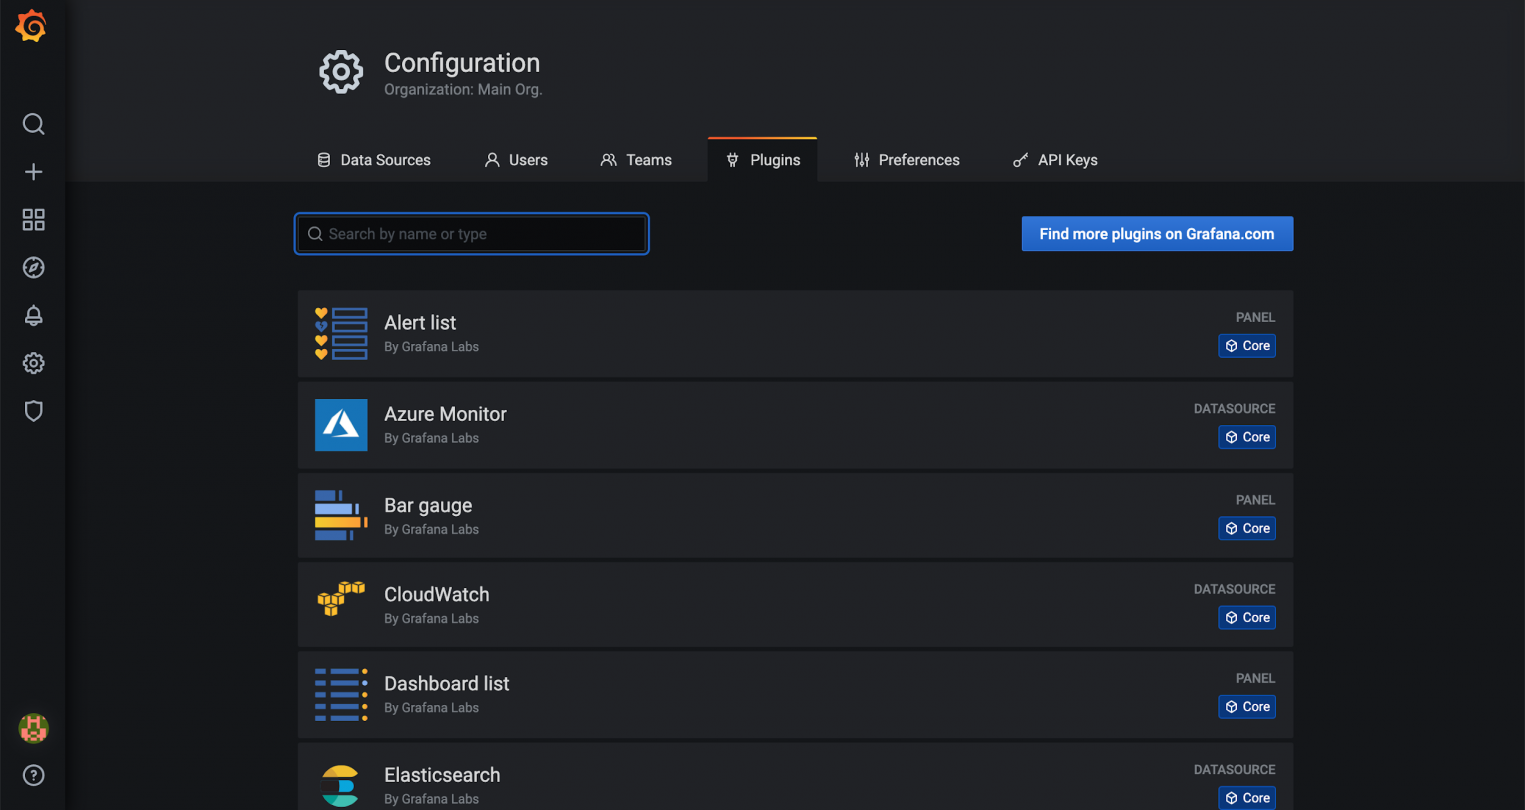
Check out the plugin page and you should be able to find and enable the Zabbix plugin:
With the result that you now have the option to use Zabbix as a Data Source:
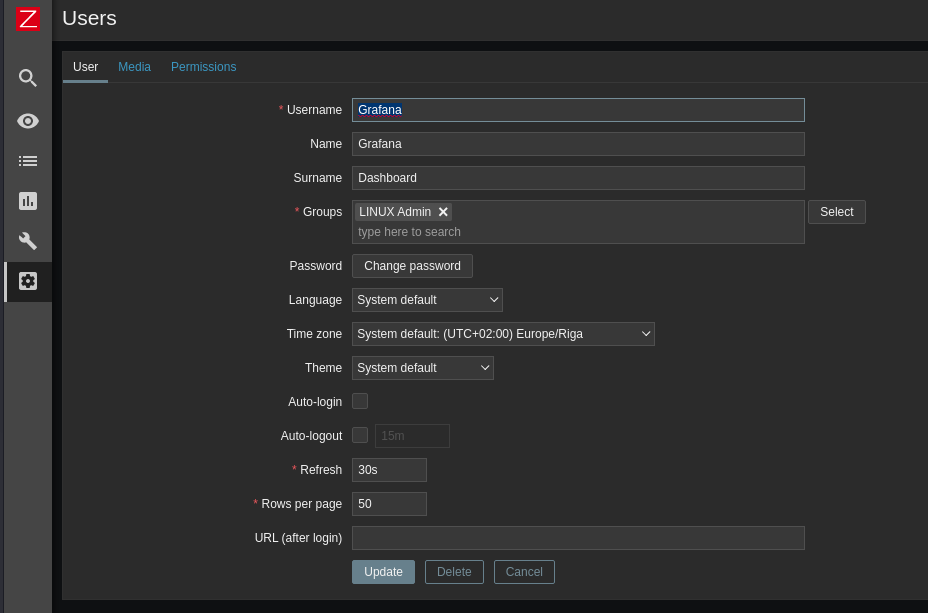
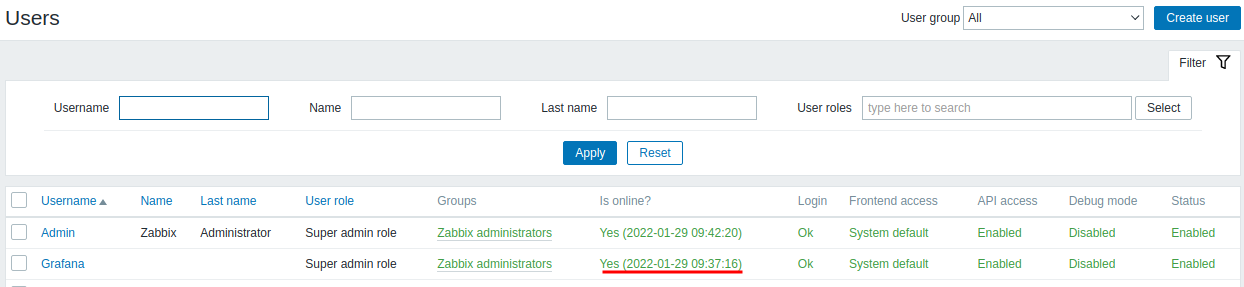
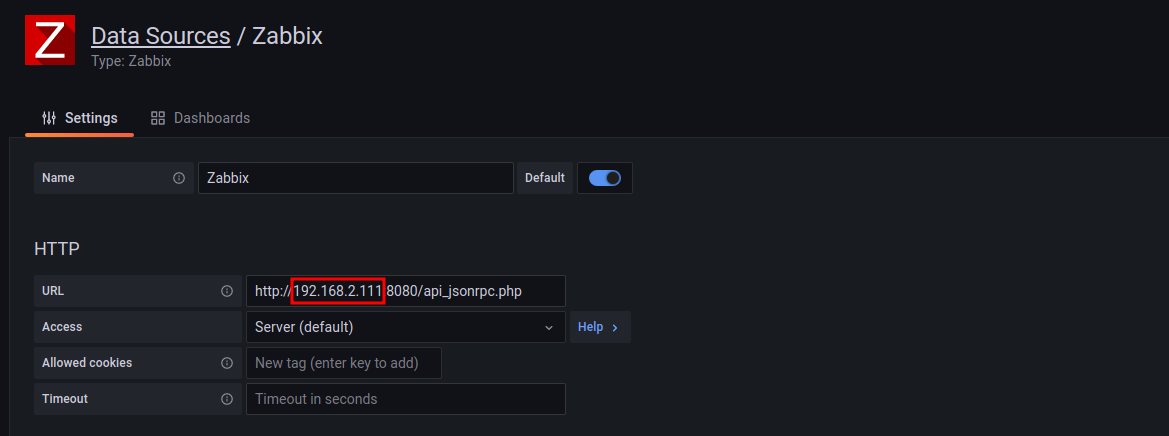
When you add the Zabbix Data Source you will be asked to add the server address https://my.domain.com/zabbix/api_jsonrpc.php as well as the login you just created — leave everything else default! For my test server I simply use the docker domain name of my zabbix-web container + port 8080 — http://zabbix-web:8080/api_jsonrpc.php:
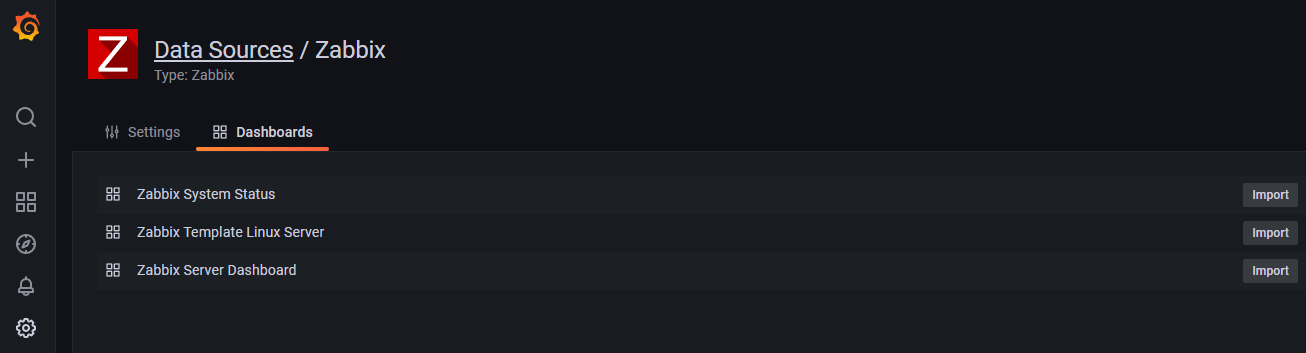
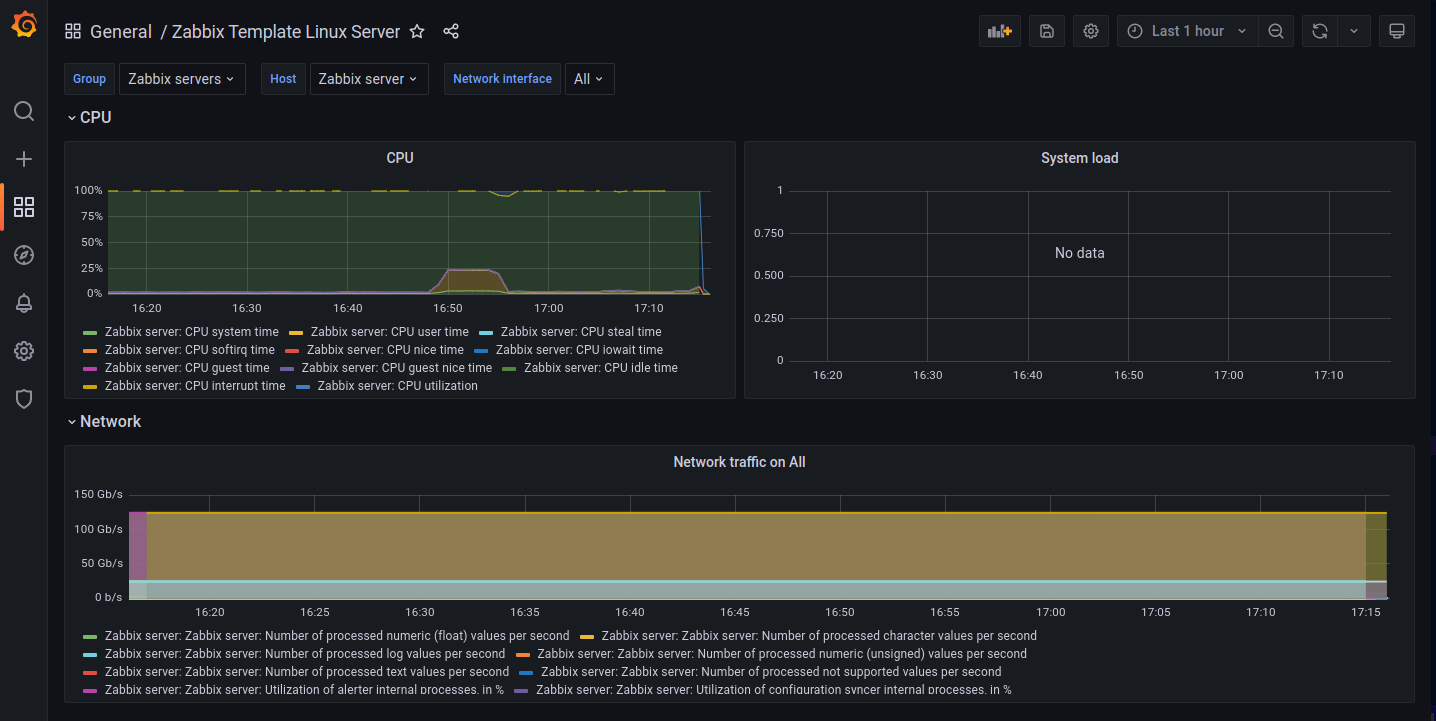
Switch from the Settings tab to Dashboards and import the dashboards templates that are included in the Zabbix plugin:
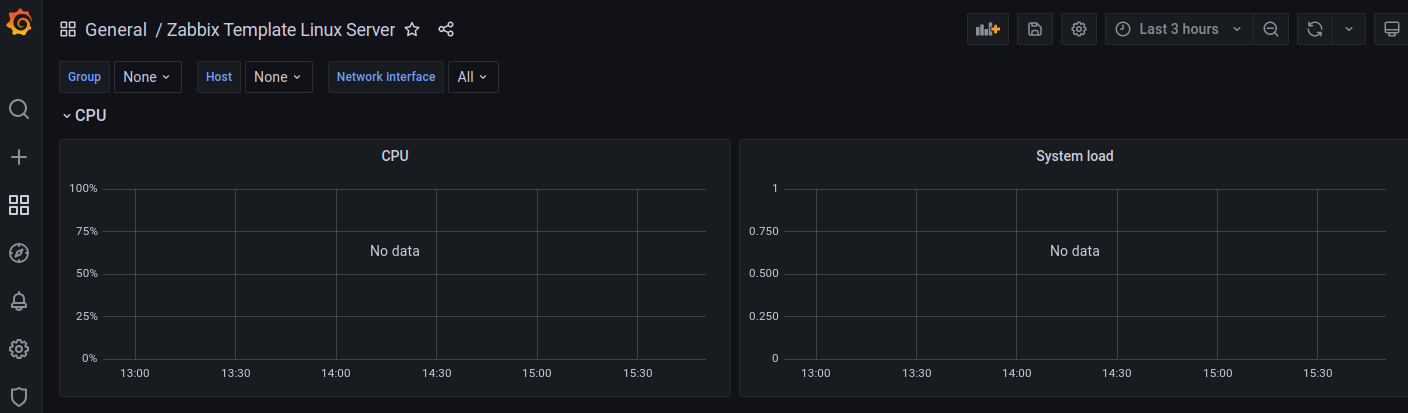
Problem — No Data
Trying to connect to the Zabbix API from a machine outside of the virtual docker network using the LAN IP of my server — http://192.168.2.111:8080/api_jsonrpc.php:
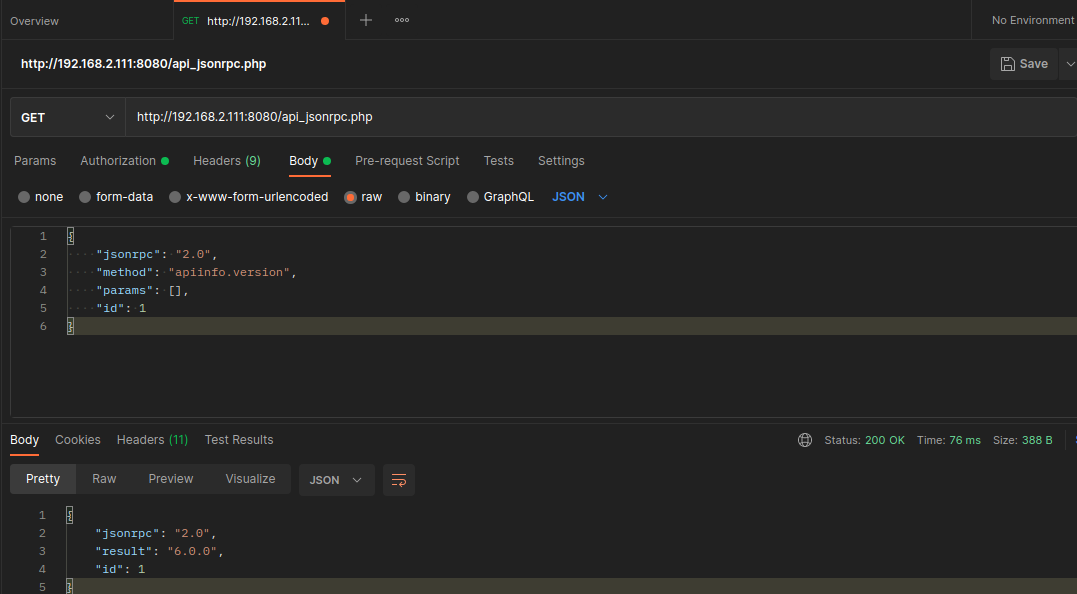
I get the same response that — presumably — the Zabbix Plugin also got when I added the data source:
Header always unset X-Frame-Options
Header set X-Frame-Options «ALLOWALL»
#tcp_nopush on;
#gzip on;
