- Sidebar
- Need to find something?
- Azure
- RabbitMQ
- Ubuntu
- Python
- Tags
- Recent Posts
- Archives
- Meta
- Введение
- Проверяем средства для мониторинга
- Setting up zabbix-agent
- Configuring zabbix server to monitor ssl certificates
- Possible errors
- Conclusion
- Did the article help? Subscribe to telegram channel author
- Zabbix additional materials
- Introduction
- Adding a website to monitoring
- Setting website monitoring schedules
- Website monitoring with authorization
- Website downtime alert
- Conclusion
- Did the article help? Subscribe to telegram channel author
- Zabbix additional materials
- Installing Zabbix Agent 2
- Setting up Docker monitoring
- Did the article help? Subscribe to telegram channel author
Sidebar
Need to find something?

Azure
- Always learning, always adapting: Unpacking Azure’s continuous cybersecurity evolution
July 27, 2023 - Microsoft responsible AI practices: Lead the way in shaping development and impact
July 27, 2023
RabbitMQ
- RabbitMQ 3.12.0 release
Ubuntu
Python
- PEP 723: Embedding pyproject.toml in single-file scripts
August 4, 2023
Tags
Recent Posts
Archives
Meta
У меня время от времени возникают ситуации, когда я пропускаю обновление какого-нибудь ssl сертификата. Особенно часто это стало происходить с повсеместным распространением сертификатов на 3 месяца от letsencrypt. Автоматическое продление иногда не срабатывает по различным причинам. Чтобы защитить себя от таких ситуаций, решил настроить полноценный мониторинг ssl сертификатов с помощью zabbix.
Если у вас есть желание научиться администрировать системы на базе Linux, рекомендую познакомиться с онлайн-курсом «Linux для начинающих»
в OTUS. Курс для новичков, для тех, кто с Linux не знаком. Подробная информация
.
Введение
У нас будут 2 отдельных списка для проверки:
- Домены с ssl сертификатами для веб сайтов
. - Домены с ssl сертификатами для почтовых серверов
.
Поясню, почему 2 списка. Ведь по сути, сертификаты в обоих случаях будут совершенно одинаковые. Дело в том, что у меня есть почтовые сервера, которые используют сертификаты, но при этом не имеют сайтов с таким же доменным именем. Для таких серверов заказаны отдельные сертификаты, которые установлены только на почтовом сервере и проверить их можно только по протоколам, которые используют почтовые серверы. Ниже я подробно раскрою все различия и способы проверки.
Если у вас еще нет готового сервера для мониторинга, предлагаю его настроить по моей статье — установка и настройка zabbix 3.4 на Centos 7
. Если предпочитаете Debian, то вот материал на эту тему — установка и настройка zabbix 3.4 на Debian 9
. В данном случае все можно сделать на одном сервере — достаточно на один сервер поставить zabbix-server и zabbix-agent.
Проверяем средства для мониторинга
Прежде чем приступим к написанию скриптов для мониторинга, предлагаю отдельно проверить технические средства, которые будем использовать. В данном случае это будет консольная утилита openssl
с различными параметрами и преобразованием ее вывода.
Для начала просто запросим сертификат сайта и проверим вывод:
# openssl s_client -connect serveradmin.ru:443 -servername serveradmin.ru -tlsextdebug
Вы должны увидеть служебную информацию по ssl сертификату и сам сертификат. Обращаю внимание на параметр -servername
. После него указано имя домена. У вас может быть ситуация, когда на одном ip хостятся несколько сайтов. Параметр -connect
фактически указывает только на ip адрес сайта. Если не указать отдельно имя домена через -servername, то команда вернет сертификат первого домена.
Теперь посмотрим на срок действия сертификата. Для этого вывод предыдущей команды завернем на нее же, но с другими параметрами. Получится вот так:
# openssl s_client -connect serveradmin.ru:443 -servername serveradmin.ru -tlsextdebug 2>/dev/null | openssl x509 -noout -dates 2>/dev/null
 notBefore=Jul 11 14:55:00 2017 GMT
notAfter=Oct 9 14:55:00 2017 GMT
На выходе должны увидеть дату создания сертификата и дату завершения его действия. Обработаем этот вывод и оставим только последнюю дату без лишних символов.
# openssl s_client -connect serveradmin.ru:443 -servername serveradmin.ru -tlsextdebug 2>/dev/null | openssl x509 -noout -dates 2>/dev/null | grep notAfter | cut -d'=' -f2
Oct 9 14:55:00 2017 GMT
Получаем то, что надо. Именно с этой датой будет работать скрипт для отправки данных в zabbix сервер.
Here is an example of a similar request, only to the smtp server:
#openssl s_client -starttls smtp -connect mail.zeroxzed.ru:25 | openssl x509 -noout -dates 2>/dev/null | grep notAfter | cut-d'='-f2
Before displaying the date itself, several lines with service information about the certificate are output. I tried for a long time to understand why they are not cut off through grep, but I did not understand. In fact, this extra output does not harm the script.
We figured out the theory and improvised means. Let’s move on to configuring zabbix agent.
Setting up zabbix-agent
Create a folder for scripts in the directory with zabbix settings:
# mkdir /etc/zabbix/scripts
First of all, let’s create 2 text files to store lists of domains.
# touch /etc/zabbix/scripts/ssl_https.txt /etc/zabbix/scripts/ssl_smtp.txt
Add domains to these files, one for each line. Next, we add scripts for auto-discovery of these domains and transfer to zabbix.
# mcedit /etc/zabbix/scripts/disc_ssl_https.sh
 #!/bin/bash
JSON=$(for i in `cat /etc/zabbix/scripts/ssl_https.txt`; do printf "{\"{#DOMAIN_HTTPS}\":\"$i\"},"; done | sed 's/ ^\(.*\).$/\1/')
printf "{\"data\":["
printf "$JSON"
printf "]}"
# mcedit /etc/zabbix/scripts/disc_ssl_smtp.sh
 #!/bin/bash
JSON=$(for i in `cat /etc/zabbix/scripts/ssl_smtp.txt`; do printf "{\"{#DOMAIN_SMTP}\":\"$i\"},"; done | sed 's/ ^\(.*\).$/\1/')
printf "{\"data\":["
printf "$JSON"
printf "]}"
Making these files executable:
 # cd /etc/zabbix/scripts
# chmod 0740 disc_ssl_https.sh disc_ssl_smtp.sh
To check, just execute one of the scripts. The output should be a list of domains in JSON format.
{"data":[{"{#DOMAIN_HTTPS}":"serveradmin.ru"}]} If there are several domains, they are listed separated by commas.
We are writing scripts that will determine how many days are left until the certificate expires. As a basis, they will take the date that we displayed in the previous step.
# mcedit /etc/zabbix/scripts/check_ssl_https.sh
 #!/bin/bash
SERVER=$1
TIMEOUT=25
REVAL=0
TIMESTAMP=`echo | date`
EXPIRE_DATE=`echo | openssl s_client -connect $SERVER:443 -servername $SERVER -tlsextdebug 2>/dev/null | openssl x509 -noout -dates 2>/dev/null | grep notAfter | cut -d'=' -f2`
EXPIRE_SECS=`date -d "${EXPIRE_DATE}" +%s`
EXPIRE_TIME=$(( ${EXPIRE_SECS} - `date +%s` ))
if test $EXPIRE_TIME -lt 0
then
REVAL=0
else
RETVAL=$(( ${EXPIRE_TIME} / 24 / 3600 ))
fi
echo ${RETVAL}
# mcedit /etc/zabbix/scripts/check_ssl_smtp.sh
 #!/bin/bash
SERVER=$1
TIMEOUT=25
REVAL=0
TIMESTAMP=`echo | date`
EXPIRE_DATE=`echo | openssl s_client -starttls smtp -connect $SERVER:25 2>/dev/null | openssl x509 -noout -dates 2>/dev/null | grep notAfter | cut -d'=' -f2`
EXPIRE_SECS=`date -d "${EXPIRE_DATE}" +%s`
EXPIRE_TIME=$(( ${EXPIRE_SECS} - `date +%s` ))
if test $EXPIRE_TIME -lt 0
then
REVAL=0
else
RETVAL=$(( ${EXPIRE_TIME} / 24 / 3600 ))
fi
echo ${RETVAL}
Making scripts executable:
# chmod 0740 check_ssl_https.sh check_ssl_smtp.sh
You can check how the scripts work like this:
 # /etc/zabbix/scripts/check_ssl_https.sh serveradmin.ru
66
# /etc/zabbix/scripts/check_ssl_smtp.sh mail.zeroxzed.ru
87
Do not forget to substitute the values of your domains in order to be sure that they normally issue certificates. At the output, you should only have a number with the number of days the ssl certificate is valid. Nothing else. This is important, otherwise the zabbix server will give an error.
We connect all our scripts with zabbix itself.
In this case, you can place scripts for monitoring certificates on any server where there is a zabbix agent. It seems to me that the most logical thing is to place all checks that are not tied to specific hosts on the zabbix server itself.
Create a file with zabbix configuration extension:
 # mcedit /etc/zabbix/zabbix_agentd.d/ssl.conf
UserParameter=ssl_https.discovery[*],/etc/zabbix/scripts/disc_ssl_https.sh
UserParameter=ssl_https.expire[*],/etc/zabbix/scripts/check_ssl_https.sh $1
UserParameter=ssl_smtp.discovery[*],/etc/zabbix/scripts/disc_ssl_smtp.sh
UserParameter=ssl_smtp.expire[*],/etc/zabbix/scripts/check_ssl_smtp.sh $1
I also recommend in the main file /etc/zabbix/zabbix_agentd.conf
increase parameter Timeout
. By default, it is set to 3. If suddenly the external check does not have enough three seconds to get information about the certificate, the item on the server will be disabled for a while. I recommend increasing the seconds to 10. Although I myself usually always set this parameter to the maximum value — 30. I often find myself forgetting about timeout, and then spending a lot of time debugging errors that arise in connection with this. So I made it a rule to always increase the timeout immediately after installation and during the initial setup of the agent.
Save all configs. We make the zabbix user the owner of all our scripts. This is important, because if this is not done, then the check in the console will work successfully, and on the server itself you will see an error item not supported
and spend some time until you understand why it appears.
# chown -R zabbix. /etc/zabbix/scripts
# systemctl restart zabbix-agent
Check how the zabbix agent returns parameters for the server. An important step before you start setting up the server itself.
 # zabbix_agentd -t ssl_https.discovery
ssl_https.discovery [t|{"data":[{"{#DOMAIN_HTTPS}":"serveradmin.ru"}]}]
# zabbix_agentd -t ssl_https.expire[serveradmin.ru] ssl_https.expire[serveradmin.ru] [t|66]
Everything works as it should. Now you can go to the server.
Configuring zabbix server to monitor ssl certificates
Template download link — ssl_cert_expiration.xml
Import this template to your server.
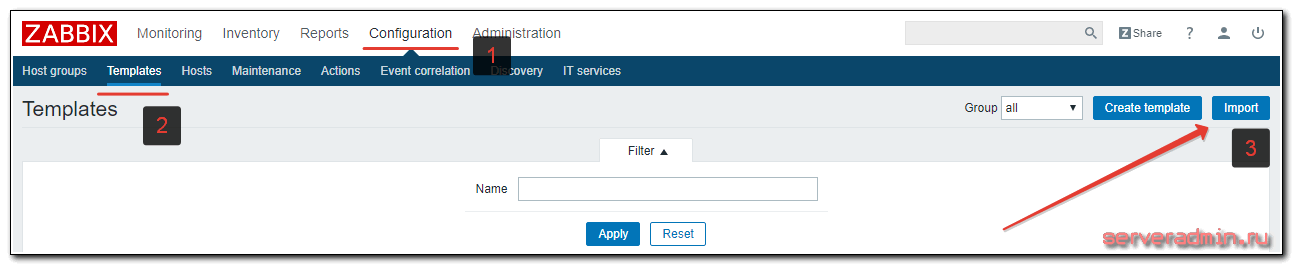
Attach this template to the host where you configured scripts and zabbix-agent. Then you just have to wait about 5 minutes. This interval is set for autodiscovery.

If you don’t need to monitor smtp hosts, you can disable smtp autodiscovery and leave only https. After auto-detect has completed, you will see the added domains in the list of items.
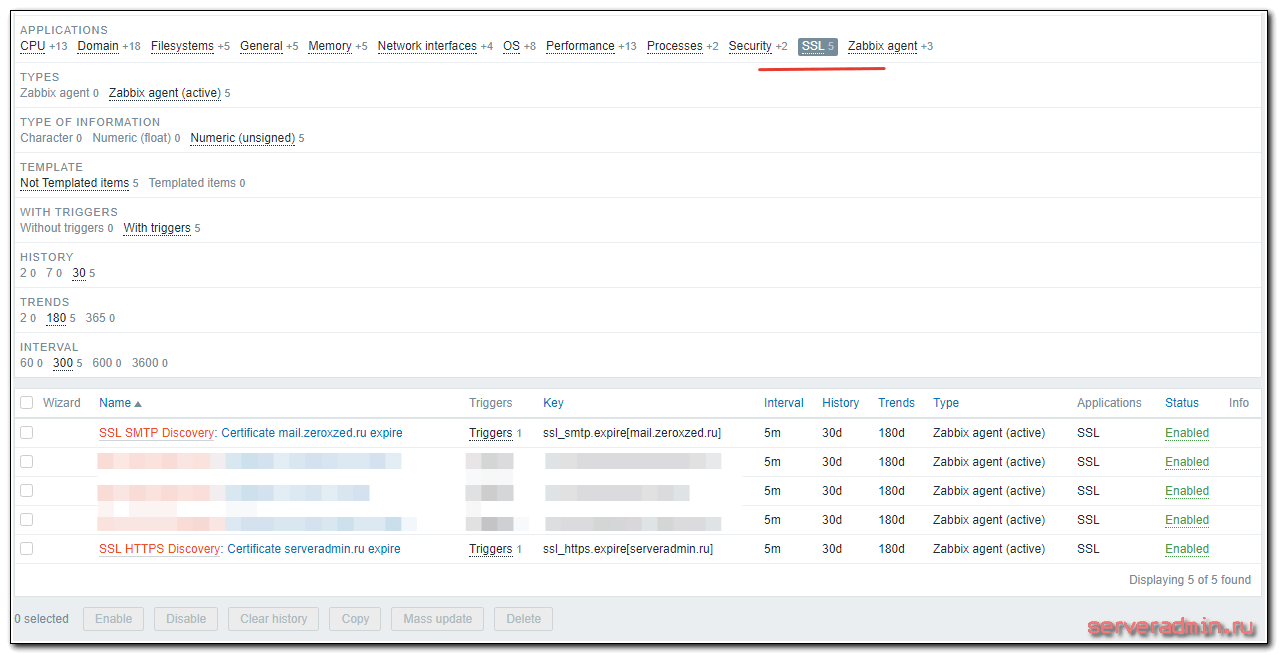
In about 5 minutes, you will receive information about the validity period of the certificates of the specified domains.
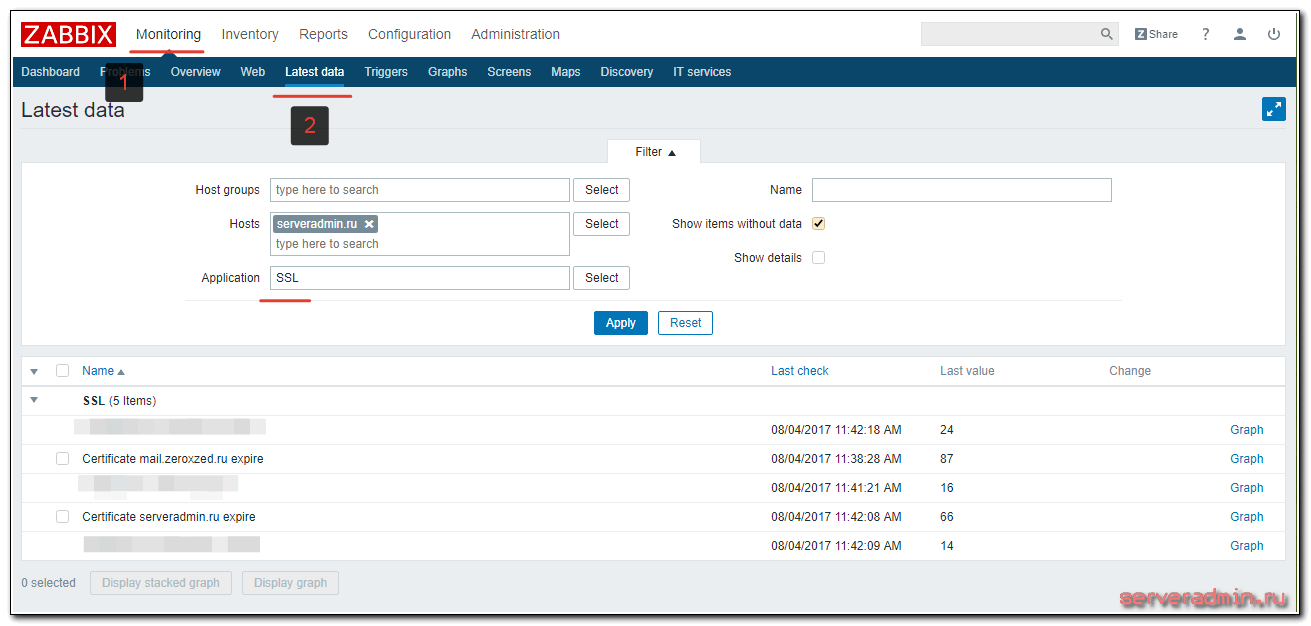
The template has a trigger that fires if the certificate lifetime becomes less than 30 days. In principle, this parameter can be reduced to 10 days. Now renew the certificate is not any problem. So you can customize this setting as you wish.
I recommend separately setting recurring notifications
for triggers from the current template. Make an interval once a day or every other day. Most likely you will not be updating right away, since it is not urgent. And what is postponed for later is easy to forget, which happened to me more than once.
Possible errors
The most common error you may encounter is that scripts do not work as the zabbix system user. And you will not understand in any way what is really wrong. Just on the server, your discovery rules or items with domains will be disabled with an error item not supported
. In order to make sure that everything is in order, check how your scripts work under the right user.
 # sudo -u zabbix /etc/zabbix/scripts/disc_ssl_https.sh
# sudo -u zabbix /etc/zabbix/scripts/check_ssl_https.sh serveradmin.ru
I have already said about one more mistake. It is related to the timeout parameter. Set it to a value higher than the standard three seconds.
Conclusion
In such a simple way, you can make your life easier. With a little skill in working with zabbix, you can monitor everything that comes to mind. Actually, that’s what I usually do. I have a bunch of custom checks. I describe the most popular and in demand in my articles, which have already accumulated a considerable amount. All of them are in the corresponding section — Zabbix
. Articles are relevant for all versions, do not become obsolete with the release of new releases.
Did the article help? Subscribe to telegram channel
author
Announcements of all articles, plus a lot of other useful and interesting information that does not get on the site.
Zabbix additional materials
If you have a desire to learn how to administer Linux-based systems, but you have never worked with them and are not familiar with them, then I recommend starting with the online course “Linux for Beginners”
in OTUS. Course for beginners, for those who are not familiar with Linux. The price for the course is minimal (symbolic). Course and price information
.
I continue my series of articles on setting up a monitoring system based on a popular free product. This time we will consider in detail the issue of setting up web site monitoring in the previously prepared zabbix server. As an example, let’s take some third-party resource and check the proposed standard functionality on it.
If you have a desire to learn how to administer systems based on Linux, I recommend that you take a look at the online course «Linux for Beginners»
in OTUS. Course for beginners, for those who are not familiar with Linux. Detailed information
.
Introduction
To monitor the web site, we will use the standard functionality of zabbix. Here are the parameters we will monitor:
- website availability
- website response time in milliseconds
- site access speed
- authorization work on the site
To do this, we will perform the following sequence of actions:
- Let’s create a template for monitoring websites.
- Let’s set up the verification scripts.
- Let’s create graphs with data.
- Let’s add triggers to check the availability and loading speed of the site.
Let’s start setting up monitoring. We will use only the standard functionality available after installation. There will be no additional user parameters or scripts to work.
If you don’t have your own monitoring server yet, I recommend materials on this topic. For those who prefer CentOS system:
Same on Debian 10 if you prefer:
Adding a website to monitoring
The easiest way to connect a site to monitoring is to add its verification on an existing host. There is one big disadvantage in this approach — if you want to enable this monitoring from another host, or simply transfer it to another server, then this will be inconvenient. It is much more convenient to monitor sites and everything related to it, set up in a separate template. So let’s go to the section Configuration -> Templates
and create a new template.
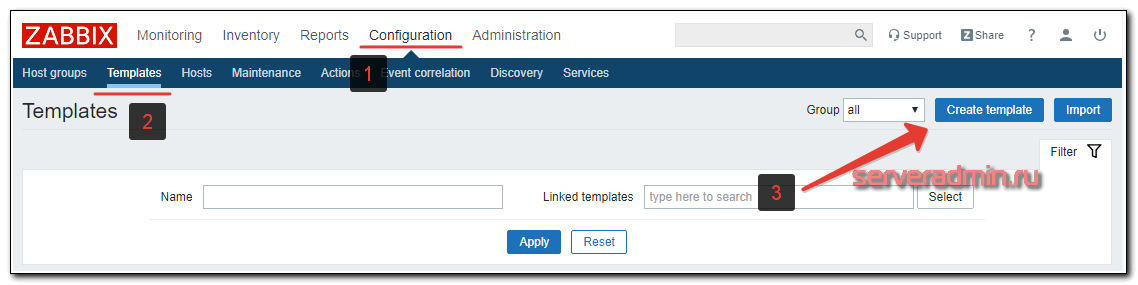
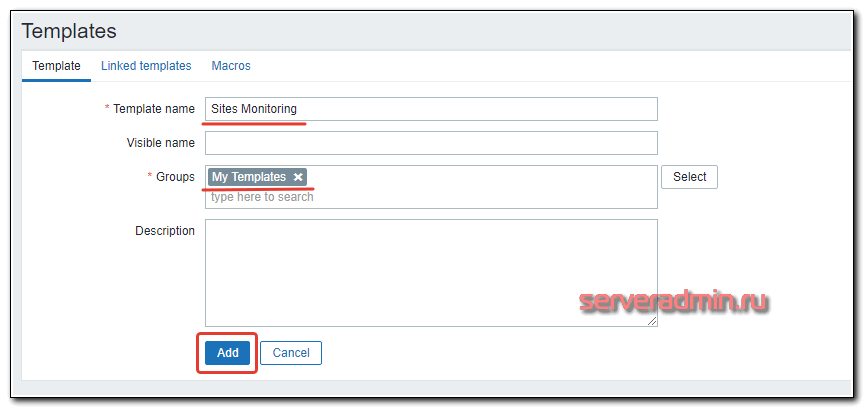
The standard template creation form opens. Enter the name of the template, where the site monitoring settings will be, and add it to any group.
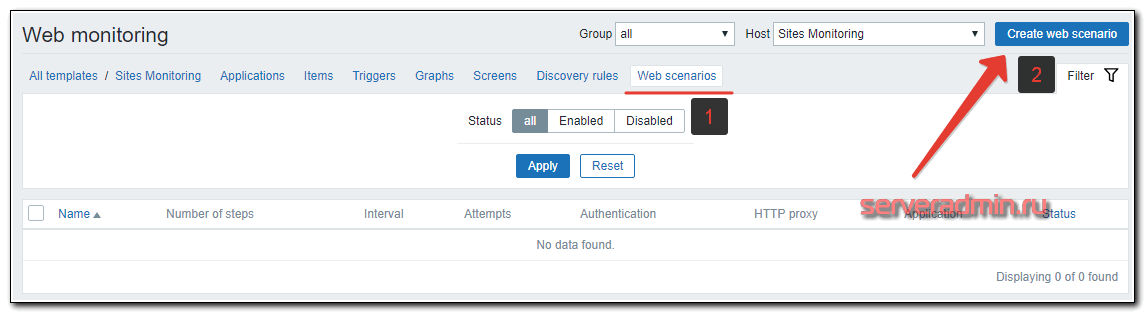
Open this template. Go to the tab Web Scenarios
and add a new script to monitor the site.
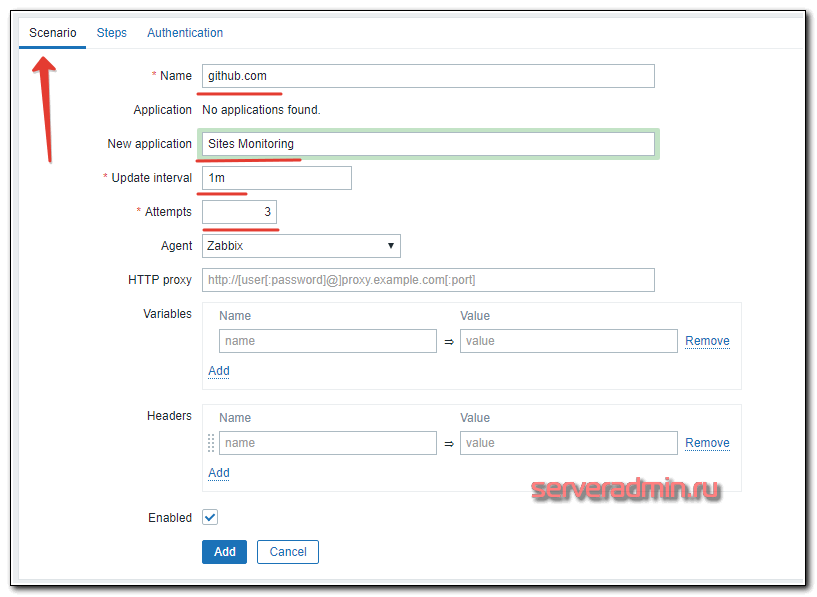
Fill in the main parameters of the scenario. As a title, I usually indicate the address of the site. In my example, this will be github.com. I immediately indicate the name of the site monitoring application for convenient sorting of items related to sites, the check interval and the number of connection attempts.
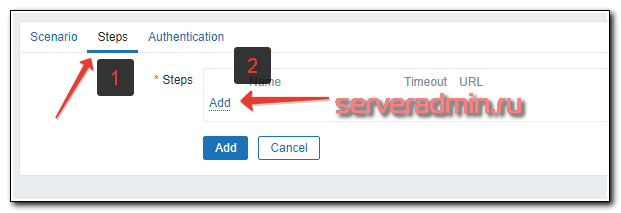
After that, I go to the tab and add a verification step.
Next, I specify the parameters of the step.
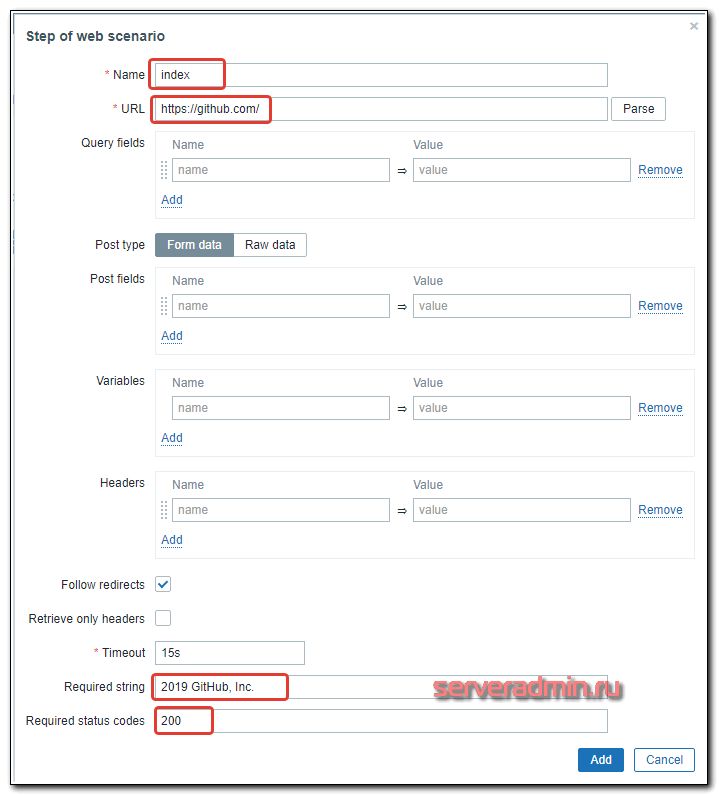
Let me explain each parameter:
- Name
— step name. In this case, the main page of the site will be checked, so I call the step index. This is not important, but I recommend giving meaningful names, so that later it would be convenient to operate with names, for example, in triggers. - URL
— URL of the checked page. - Required string
— a string on the page that zabbix will look for. I took the line from the footer of the site. If zabbix finds it on the page, it will assume that everything is in order with the site. If not, it will throw an error. - Required status codes
— the required response code. I specify 200. If zabbix receives some other code in response from the web server, it will consider that the check failed.
After filling in all the parameters, click to add a step and then again to add the verification script itself. It should look like this picture.
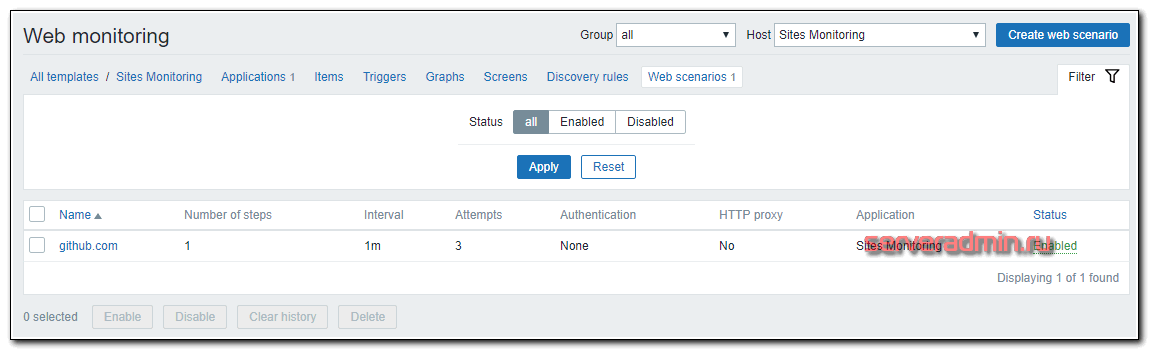
The simplest check of site accessibility is done. Next, we need to attach this template to some host so that the real checks begin. I will attach the template to the zabbix server itself. To do this, go to Configuration -> Hosts
, select Zabbix Server and attach the previously created template to it.
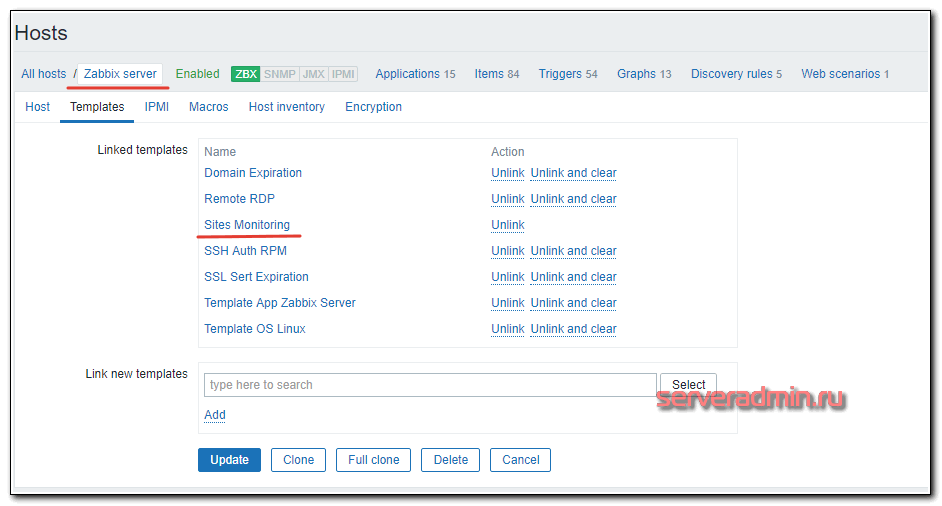
We wait a few minutes and go to the section Monitoring -> Web
view the results of monitoring the site github.com.
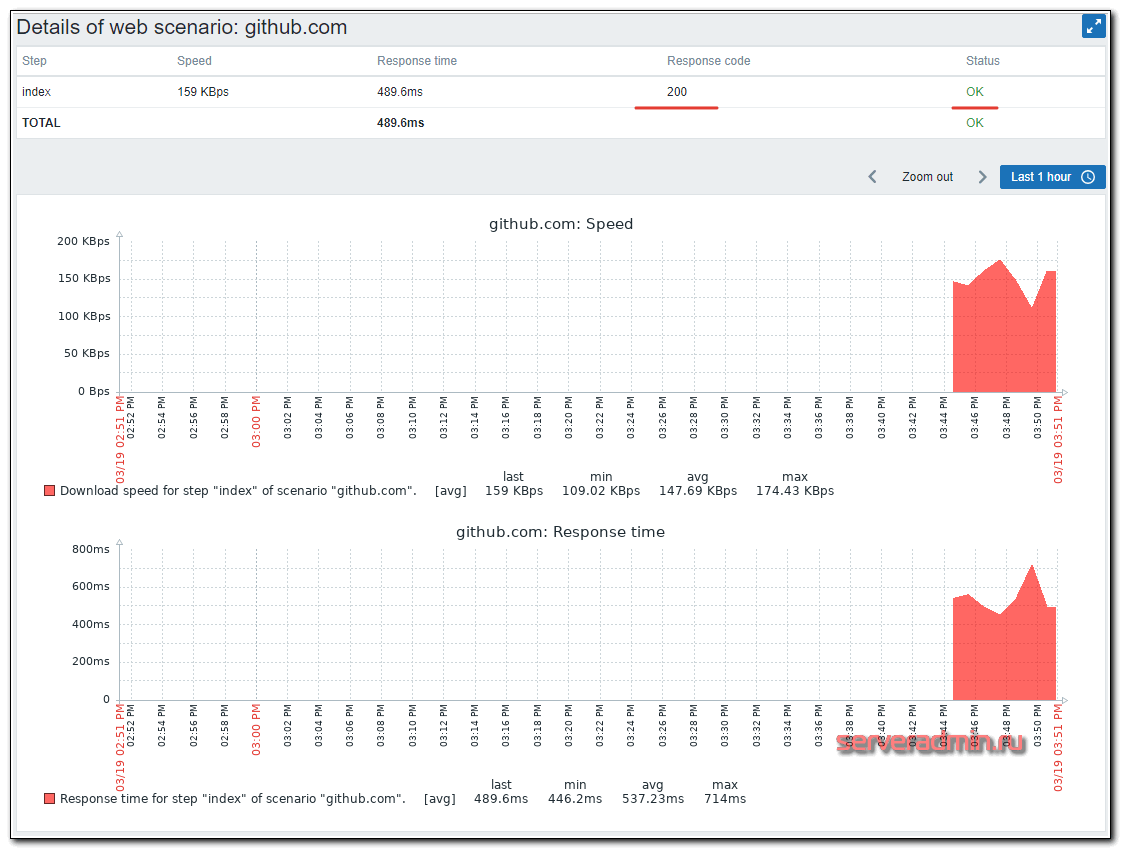
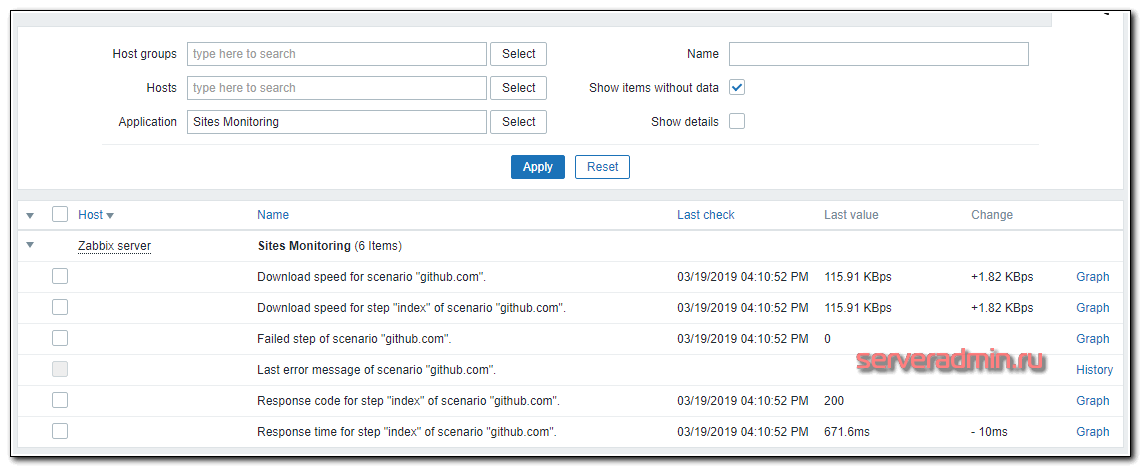
Parameter value Failed step of scenario «github.com»
equal to 0 means that all site verification steps were completed without errors. If you have several steps and one of them ends with an error, the number of this step will be here. That is, in the general case, everything that is not 0 is some kind of problem. Later we will use this in the trigger. In the meantime, let’s add a couple of charts to the template, which can then be used in dashboards.
Setting website monitoring schedules
We return to our template and go to the section Graphs
. We create a new chart.
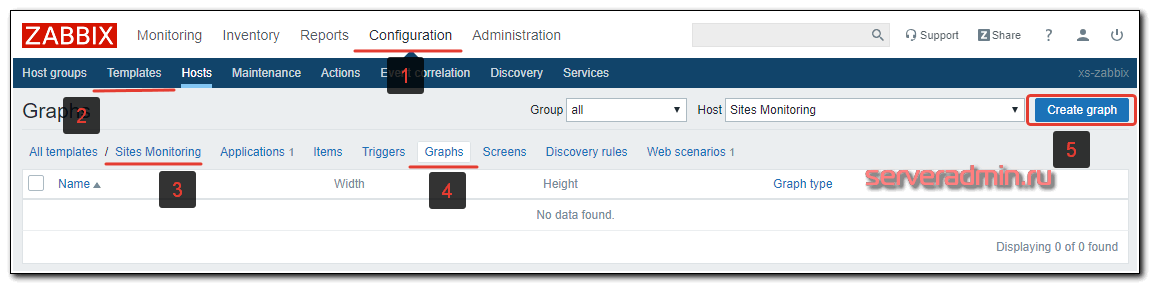
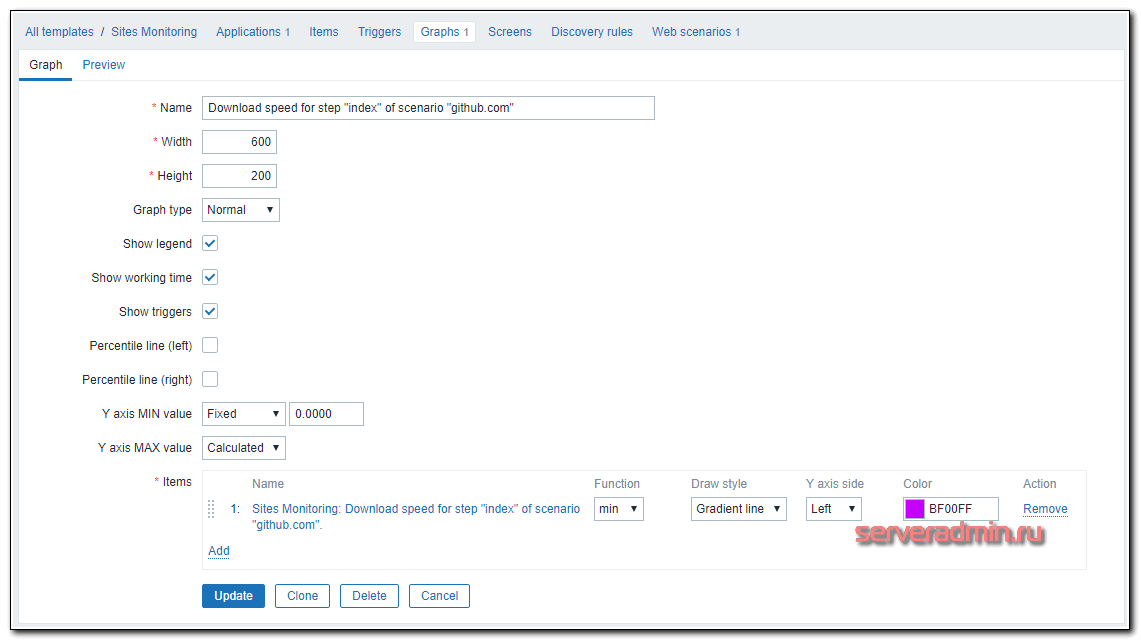
Let’s add a graph of the loading speed of the main page of the site.
By analogy, you can add a site response time graph. I once added both of these graphs to Screen. It turned out like this.
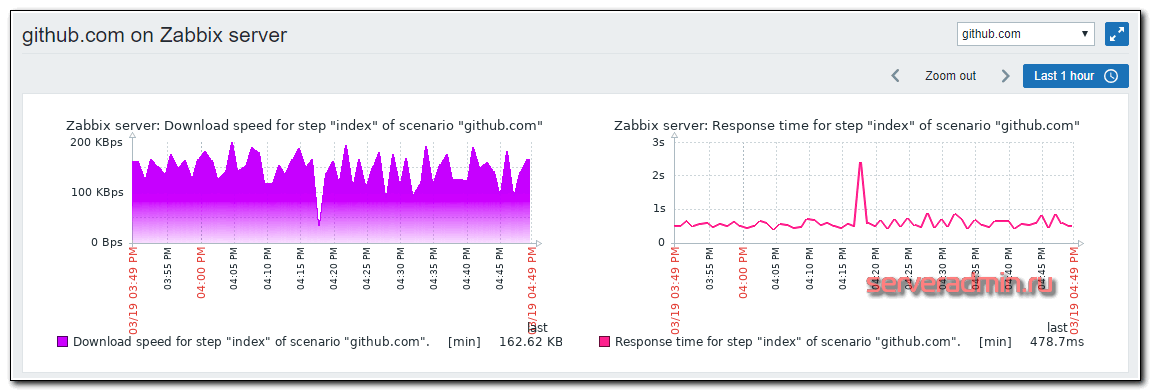
For more beautiful visualizations, it is better to use Dashboards. Now let’s set up site monitoring with authorization.
Website monitoring with authorization
Let’s complicate the task a little. Let’s try to perform authorization on the site and monitor both the authorization itself and the closed page behind it. For example, I will take the centos.org/forums/ forum, log in to it, and after authorization I will check the page with the personal information of a particular user.
In order to set up site monitoring with authorization in zabbix, you need to correctly form a post request for this very authorization. I do it in the following way. I go to the login page. In this case it is https://www.centos.org/forums/ucp.php?mode=login
, open DevTools in Chrome, Network tab. I fill in the fields of the authorization form with deliberately incorrect data so that the authorization fails. After this error I look headings of the very first request.
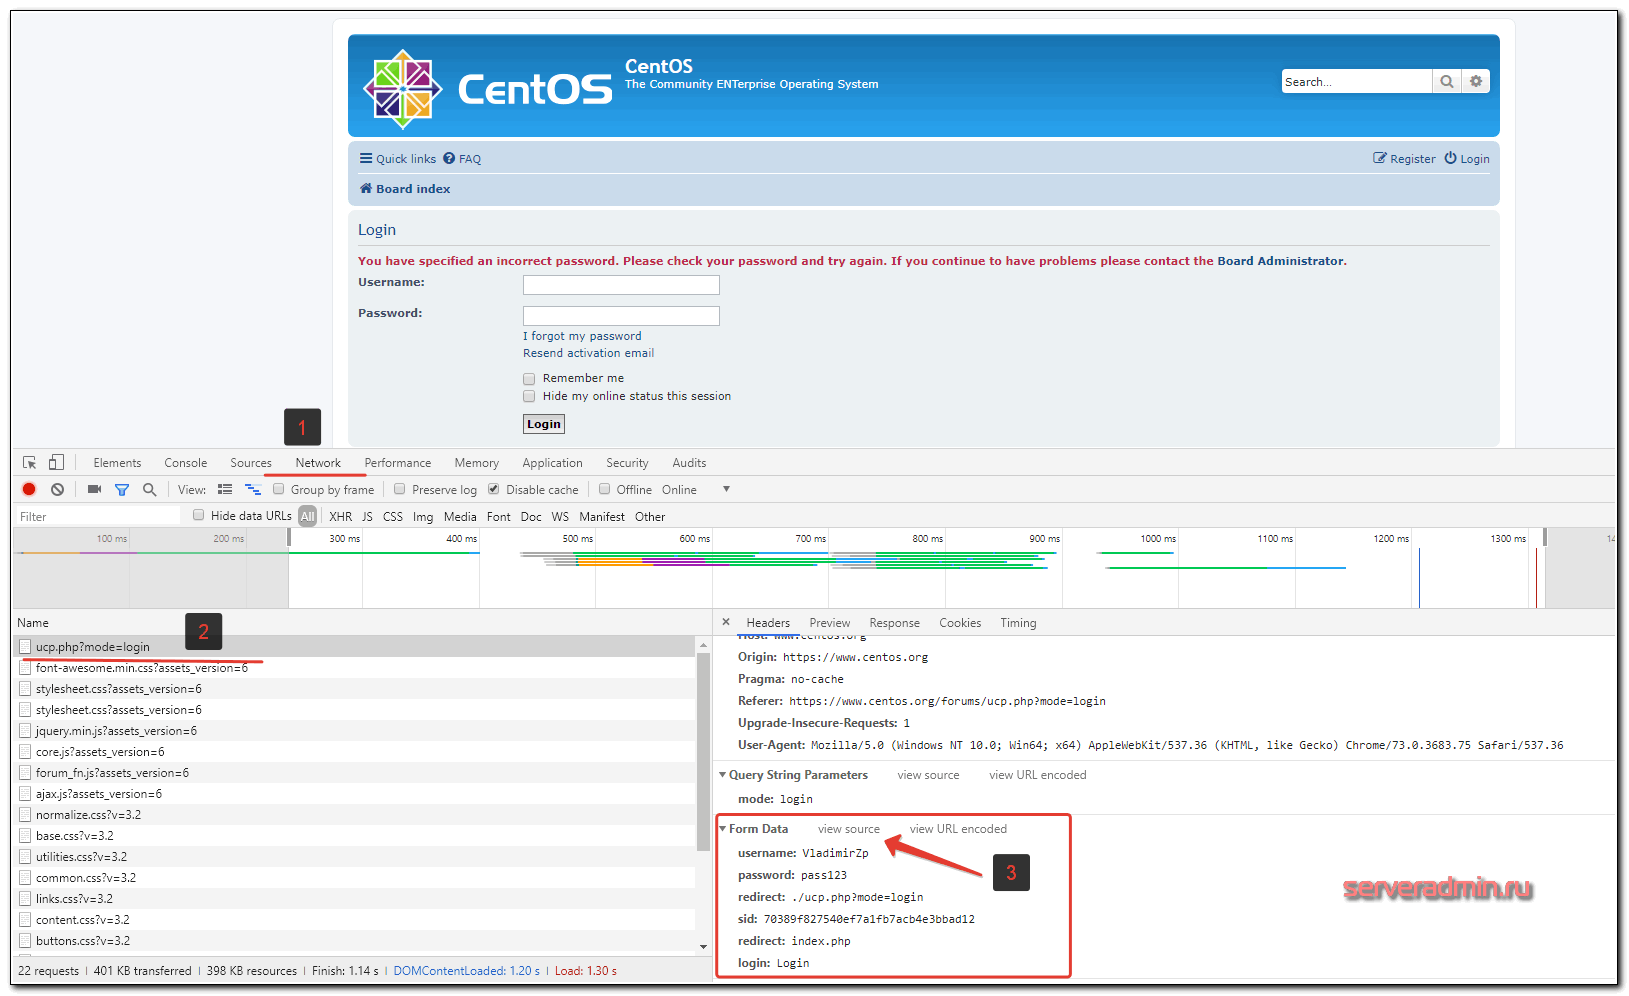
I click on view source in the Form Data section and copy the resulting string. In my case, it was like this:
username=VladimirZp&password=pass123&redirect=.%2Fucp.php%3Fmode%3Dlogin&sid=70389f827540ef7a1fb7acb4e3bbad12&redirect=index.php&login=Login
From here you can definitely remove the redirect parameter. As a result, I save this line:
username=VladimirZp&password=pass123&sid=70389f827540ef7a1fb7acb4e3bbad12&redirect=index.php&login=Login
Now I go to the site monitoring template and add a new site — centos.org. I create the first step with authorization, I call it auth. In it, I specify the post request for authorization.
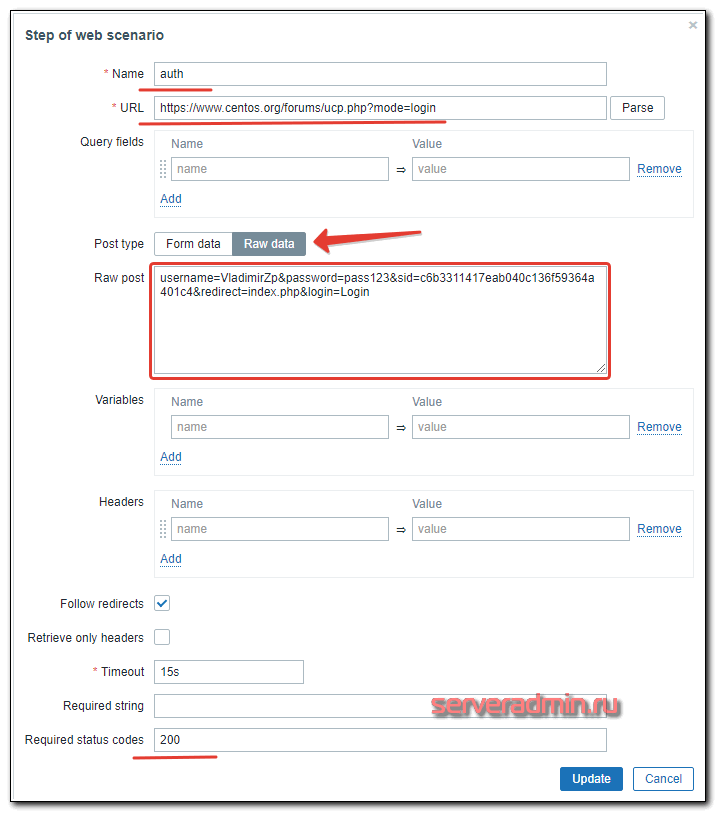
Don’t forget to change the password to the correct one. After successful authorization, you will see the main page of the forum, where there will be a link to private forum messages. This link is available only after authorization.
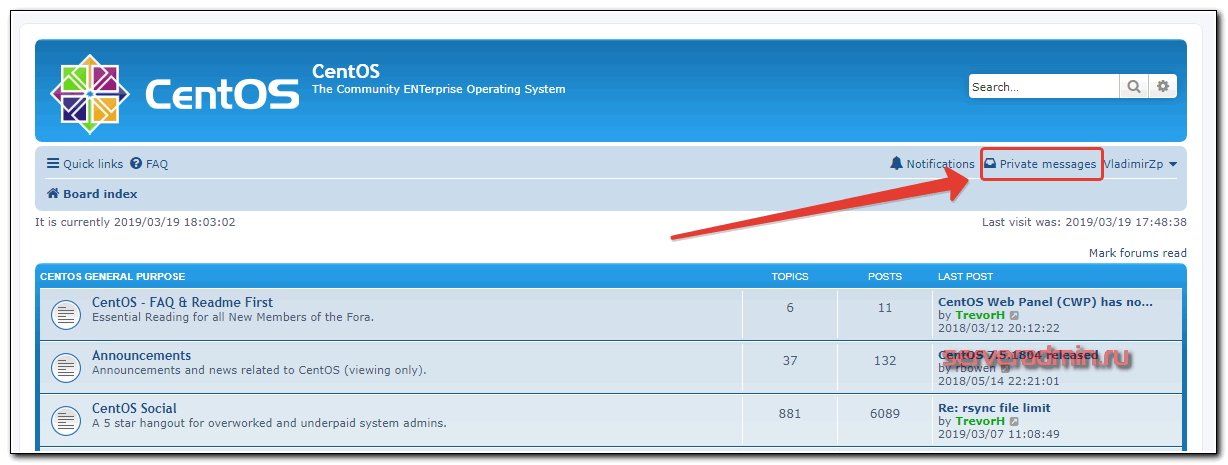
The next step is to check the string Private messages
on the main page of the forum.
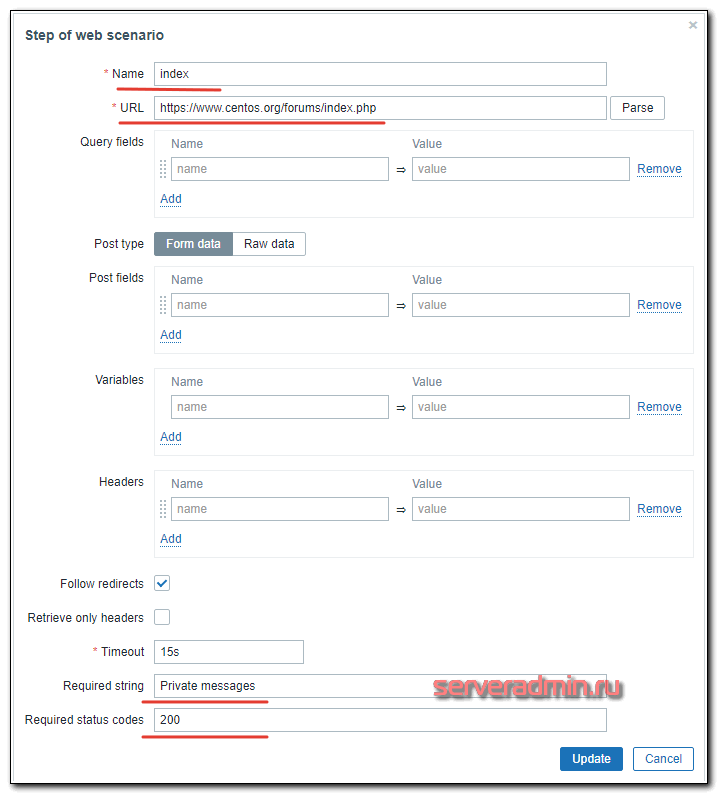
The steps are performed sequentially. At the first step, we only log in, at the second step we check the page available after authorization. Go to Latest Data
and see the result.
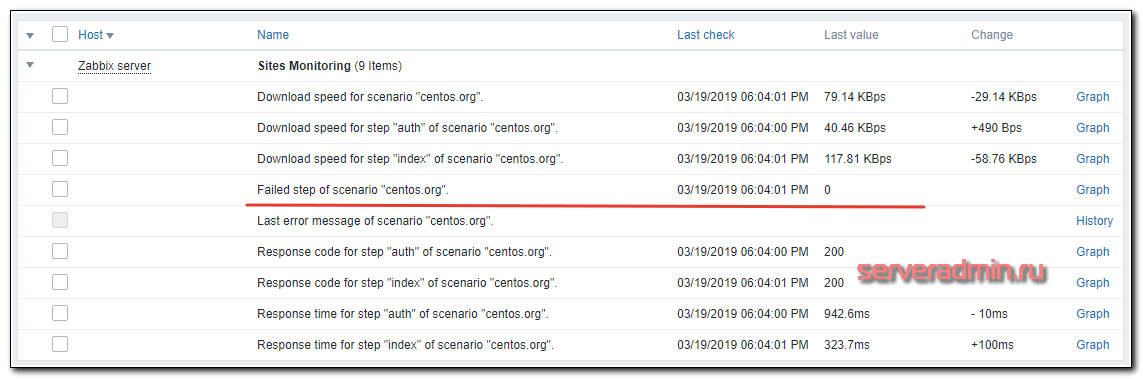
Both steps completed successfully, no errors. Let’s look at the section Monitoring -> Web
.
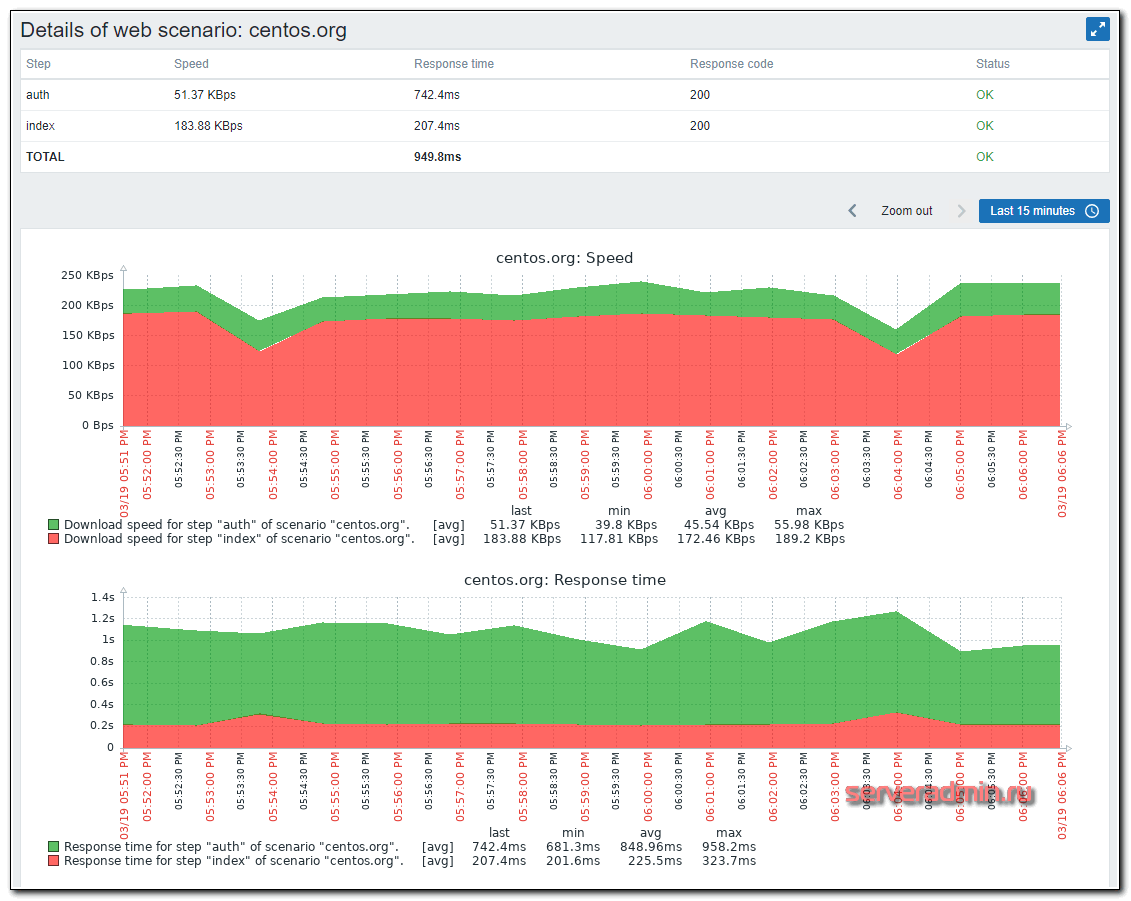
Everything is fine here too. It is clearly seen that the authorization process is much longer and slower than loading the main page.
Website downtime alert
Let’s set up problem notifications on the site. I offer 2 types of notification:
- About the low speed of access to the site.
- About the unavailability of the site in general.
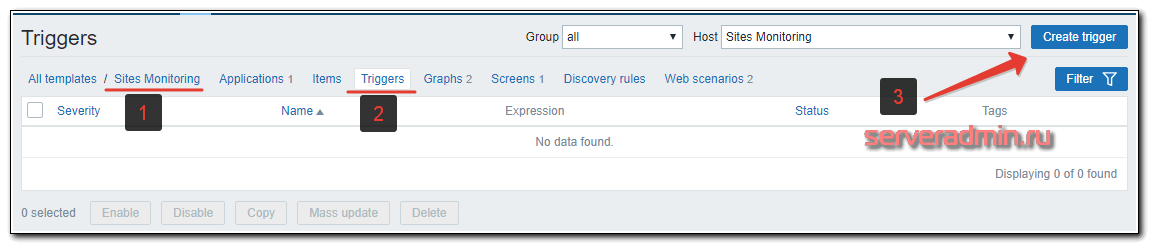
We go, as usual, to the original template, to the tab Triggers
and add a new one.
I propose the following trigger condition to determine if the site is unavailable. If the average value of the last 3 checks is greater than or equal to one, then the site is not available.
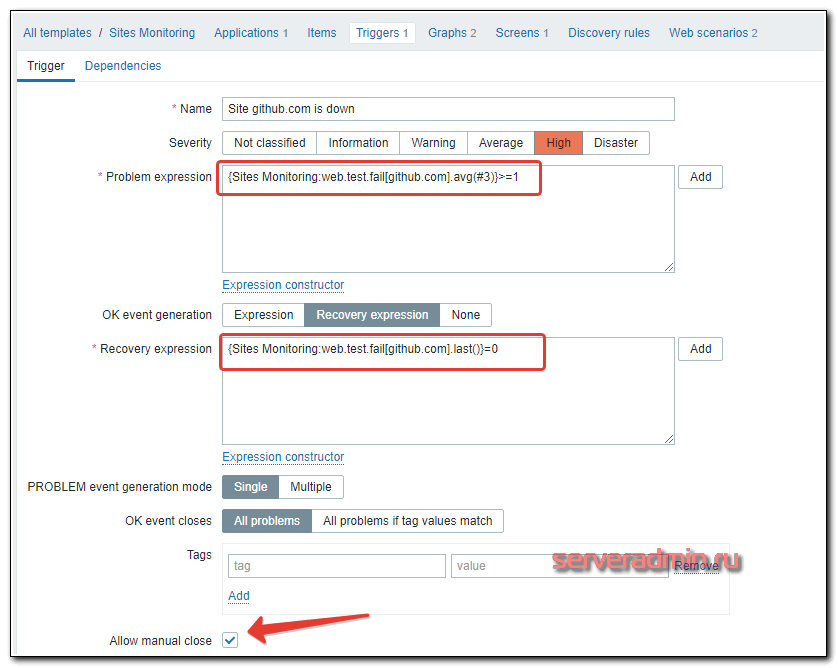
When it goes 0 in all checks, everything is fine. The trigger will fire only if all 3 last checks are non-zero. In my example, the Failed step can be either 0 or 1, where 1 is the number of the failed step. If you have several steps, then the second step or the third step may turn out to be a failure. That is, the value can be greater than 1. But in any case, if the last 3 values in a row are strictly not 0, then the trigger fires. The recovery operation is very simple. If the last check without an error, that is, the code is 0, then we consider that the site is already working.
To check the operation of the trigger, it is enough to add the following line to the /etc/hosts file on the zabbix server:
127.0.0.1 github.com
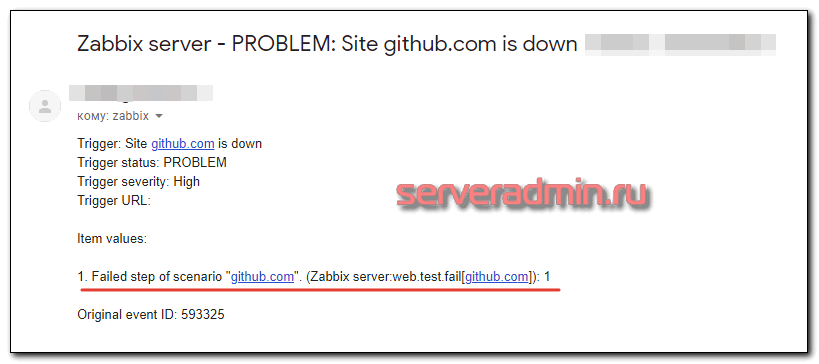
and wait 3 minutes for 3 failed checks. After that, you should have been sent a notification about the unavailability of the site. I got this:
Next, we check the server response time. Here everyone is free to adjust as it seems to him more correct and convenient. I am using this scheme. I take the average response time of the site and multiply it by 3. Then I look at the last 7 checks. If in 5 checks among these seven there were values higher than three times the average response time, then I think that the site is slow and a notification should be sent. A little confused, but in practice, such a scheme has worked well for me without false positives. At the same time, if there are real problems, I see them. Draw a trigger.

Recovery condition — in the last three requests, two or more were faster than three times the average access time. Expression text to copy:
 {Sites Monitoring:web.test.time[github.com,index,resp].count(#7,1.5,"ge")}>4
{Sites Monitoring:web.test.time[github.com,index,resp].count(#3,1.5,"lt")}>1
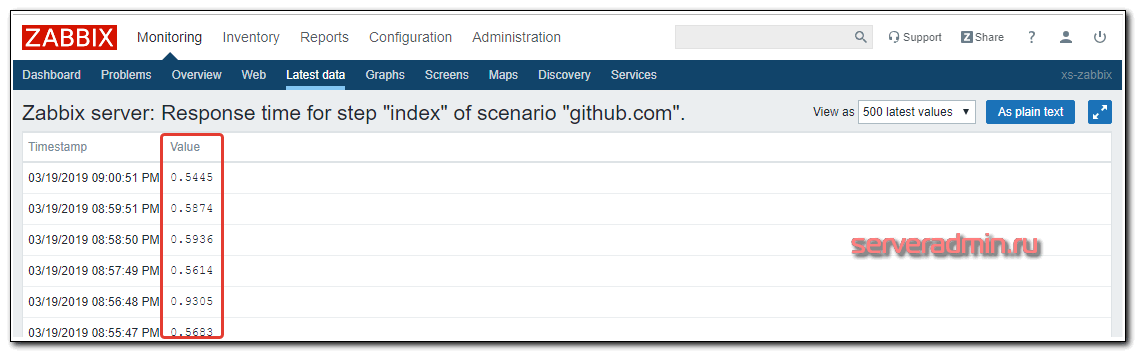
In expression 1.5, this is the response time in seconds. It is in this form that it enters the zabbix server. You can check in Latest Data
.
In conclusion, I leave my template, which I created for writing an article. You can copy and edit it to fit your sites. It’s faster than starting from scratch. Template exported from zabbix 4.0 — sites_monitoring.xml
That’s all, website monitoring is working, authorization is being checked, notification about site unavailability is configured. To complete the picture, you can create Screen or Dashboard
with the output of all the necessary parameters on one screen. Its settings will already depend on the specific situation and the data that you have. For example, if you have configured web server monitoring
, then you can place graphs of its loading and access parameters to the site next to it. There you can also add the load of the server itself in terms of processor and memory and display a schedule for using the network interface.
In this regard, Zabbix is very flexible and allows you to customize everything for every taste and for any requirements.
Conclusion
I’ll add a few words on how this web site monitoring can be used. I had two hosting and wanted to choose one faster. The load on the server itself for hardware was so low that it could not be taken into account at all. The more important parameter was the server response time and the speed of access to it. I launched the site on both servers and set up monitoring. According to its parameters, I chose a faster server.
Of course, here you need to understand that the data of such monitoring is very conditional and depends on where the Zabbix server itself is located. It is possible that monitoring of all sites will show approximately the same numbers due to the limitation of the monitoring server itself. You need to keep this in mind. Quite often, when checking the response time of a site, there are large dips in time up to 5-10-15 seconds. This greatly affects the average access time. These failures occur due to temporary network problems, not necessarily on the site itself. This should also be taken into account when analyzing the obtained data.
In any case, you need to think carefully about the analysis of site monitoring data. In most cases, it is not the values themselves that are important, but the general trends in their change in comparison with other hosts. Consider this. That’s all for me.
Did the article help? Subscribe to telegram channel
author
Announcements of all articles, plus a lot of other useful and interesting information that does not get on the site.
Zabbix additional materials
If you have a desire to learn how to administer Linux-based systems, but you have never worked with them and are not familiar with them, then I recommend starting with the online course “Linux for Beginners”
in OTUS. Course for beginners, for those who are not familiar with Linux. The price for the course is minimal (symbolic). Course and Price Information
.
A few releases ago, Zabbix announced a new agent that extends its functionality using plugins. Today I will look at how to set up monitoring of Docker containers using Zabbix Agent 2 using a basic template. At the same time, I’ll see what the new agent is like.
If you have a desire to learn how to administer systems based on Linux, I recommend that you take a look at the online course «Linux for Beginners»
in OTUS. Course for beginners, for those who are not familiar with Linux. Detailed information
.
I have already made a note about Zabbix Agent 2
, where he listed the main differences from the previous agent. There are a lot of them, so I recommend that you read before continuing. Over time, it will be the 2nd version that will be developed, and the old agent will simply be supported in the form it is now. New functionality will no longer be imported into it.
If you don’t have your own monitoring server yet, I recommend materials on this topic. For those who prefer CentOS system:
Same on Debian 10 if you prefer:
Installing Zabbix Agent 2
On the host where the Docker containers that we monitor are running, you need to install the Zabbix agent. The installation will depend on the host system, but in general it is just connecting the desired repository and installing through the package manager.
At the time of this writing, the latest version of Zabbix was 5.4, so I’m showing you how to install Zabbix Agent 2 of this particular version.
 # wget https://repo.zabbix.com/zabbix/5.4/ubuntu/pool/main/z/zabbix-release/zabbix-release_5.4-1+ubuntu20.04_all.deb
# dpkg -i zabbix-release_5.4-1+ubuntu20.04_all.deb
# apt update
# apt install zabbix-agent2
 # wget https://repo.zabbix.com/zabbix/5.4/debian/pool/main/z/zabbix-release/zabbix-release_5.4-1+debian10_all.deb
# dpkg -i zabbix-release_5.4-1+debian10_all.deb
# apt update
# apt install zabbix-agent2
Centos 8 and other rpm-based distributions:
 # rpm -Uvh https://repo.zabbix.com/zabbix/5.4/rhel/8/x86_64/zabbix-release-5.4-1.el8.noarch.rpm
# dnf clean all
# dnf install zabbix-agent2
We do the basic setup of the agent. Add to config /etc/zabbix/zabbix_agent2.conf
server and hostname information.
 Server=10.20.1.1
ServerActive=10.20.1.1
Hostname=docker-host
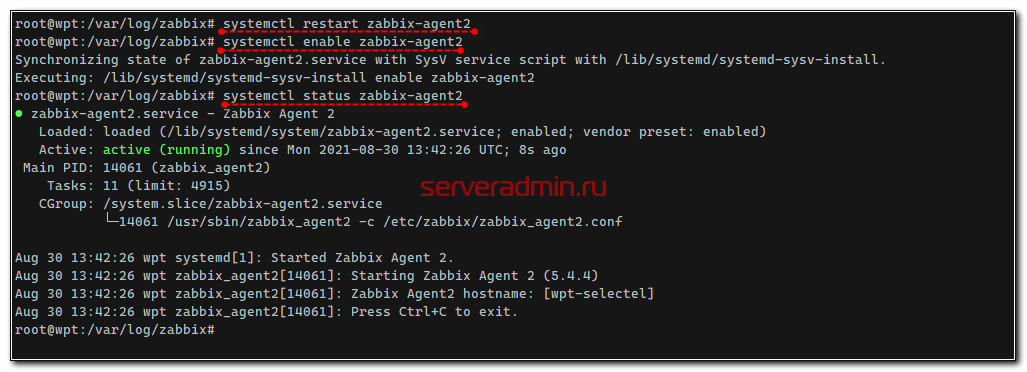
Restart zabbix-agent2 and add it to startup.
 # systemctl restart zabbix-agent2
# systemctl enable zabbix-agent2
Additionally, we need to add the zabbix user, on whose behalf the agent runs, to the docker group so that he has access to docker.sock
.
# usermod -aG docker zabbix
After that, you need to restart the host for the changes to take effect. If you do not want to do this or there is no way, you can directly issue rights.
# setfacl --modify user:zabbix:rw /var/run/docker.sock
Now go to the Zabbix monitoring server. Further configuration will take place there.
Setting up Docker monitoring
First of all, let’s go to the Zabbix server console and make sure that it can correctly collect Docker data from the observed host. To do this, use the utility zabbix_get
.
# zabbix_get -s 10.20.50.7 -k docker.info

If you get an error:
ZBX_NOTSUPPORTED: Cannot fetch data: Get http://1.28/info: dial unix /var/run/docker.sock: connect: permission denied.
Go back to the host with the agent and docker and check the permissions of the zabbix user on the docker socket. Above, I showed what needs to be done.
If everything is in order with access, then go to the web interface of the monitoring server. We need to add the appropriate template to the observed host with Docker. It’s called Docker by Zabbix agent 2
.
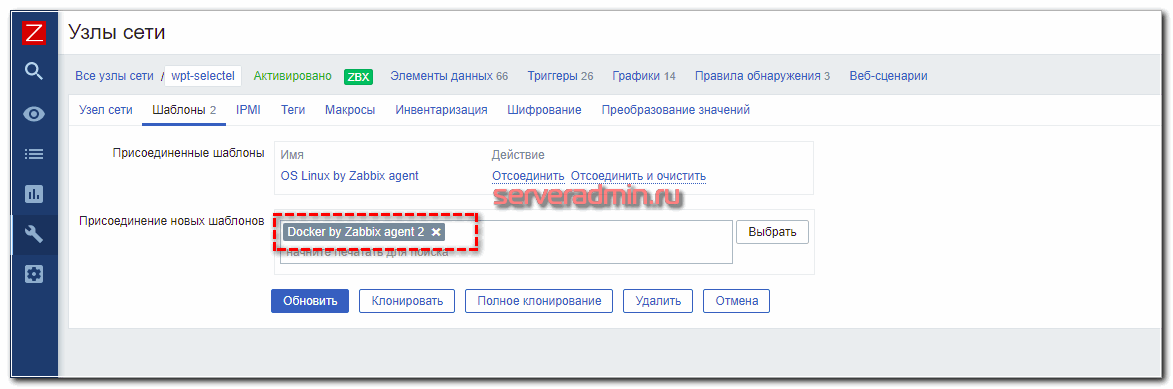
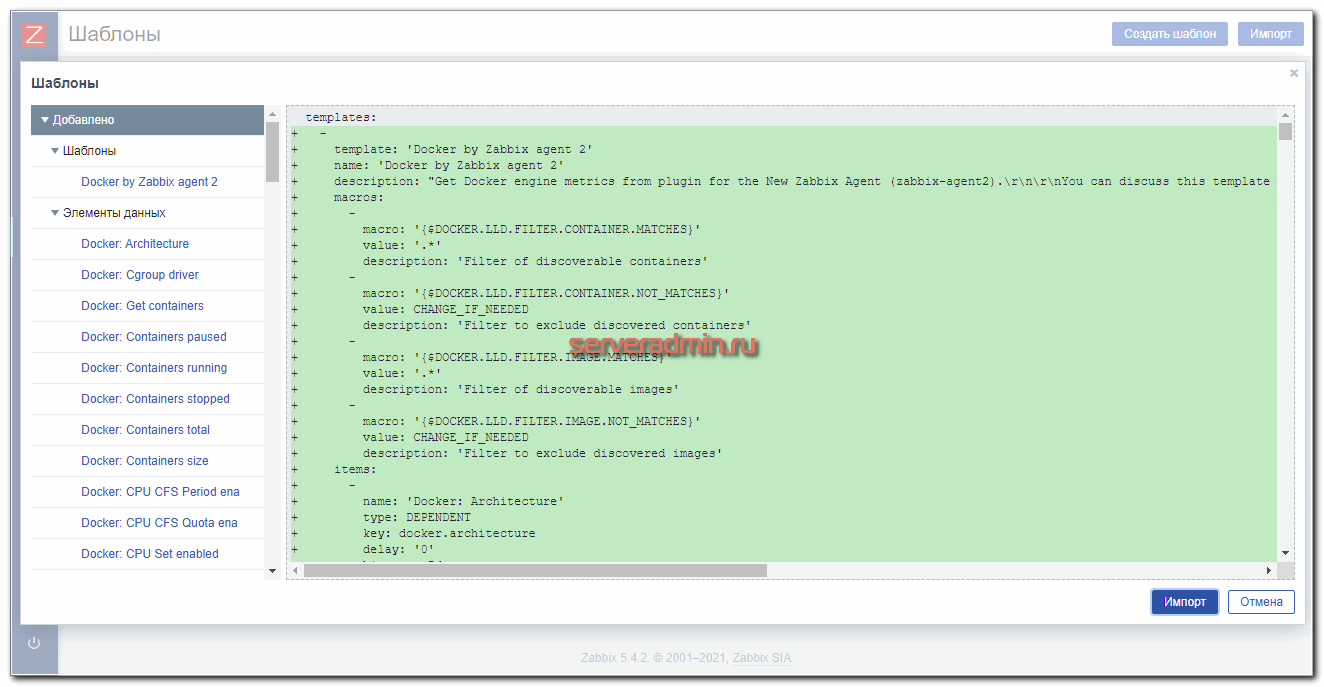
This completes the Docker monitoring setup. He has already earned. The template has auto-discovery rules for images and containers that run every 15 minutes. To speed up the start of data collection, you can manually start them.
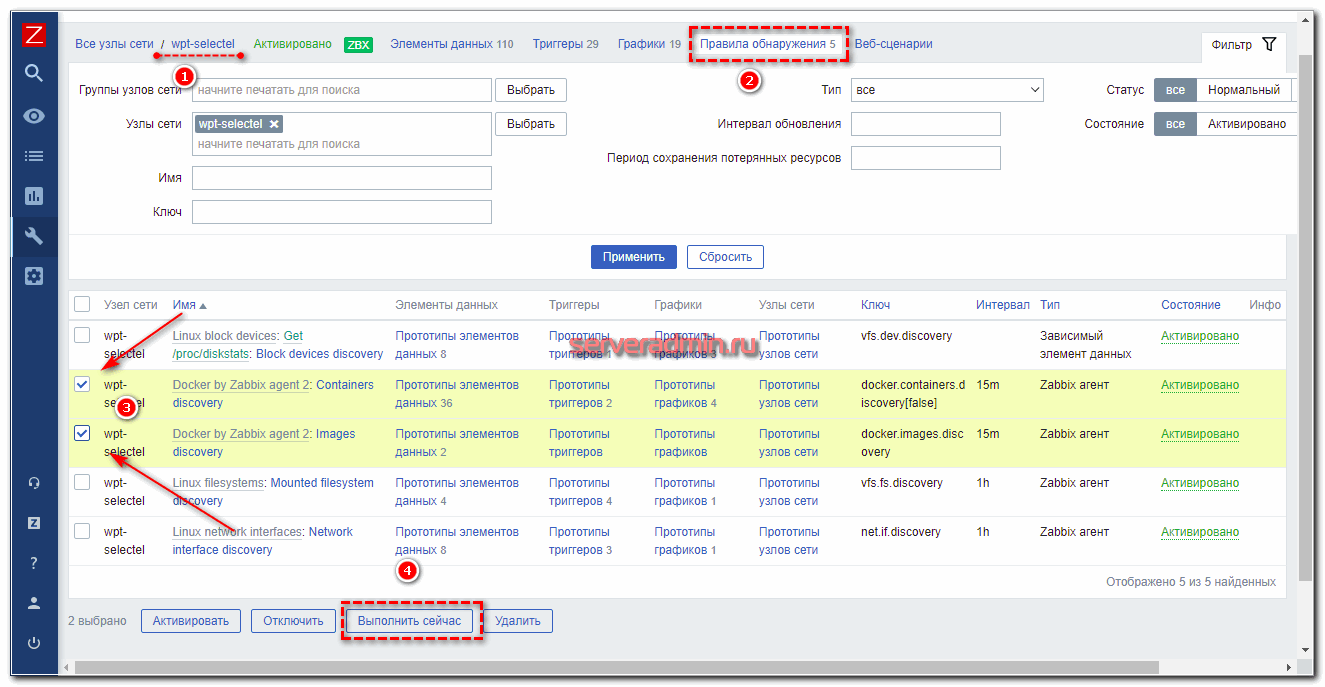
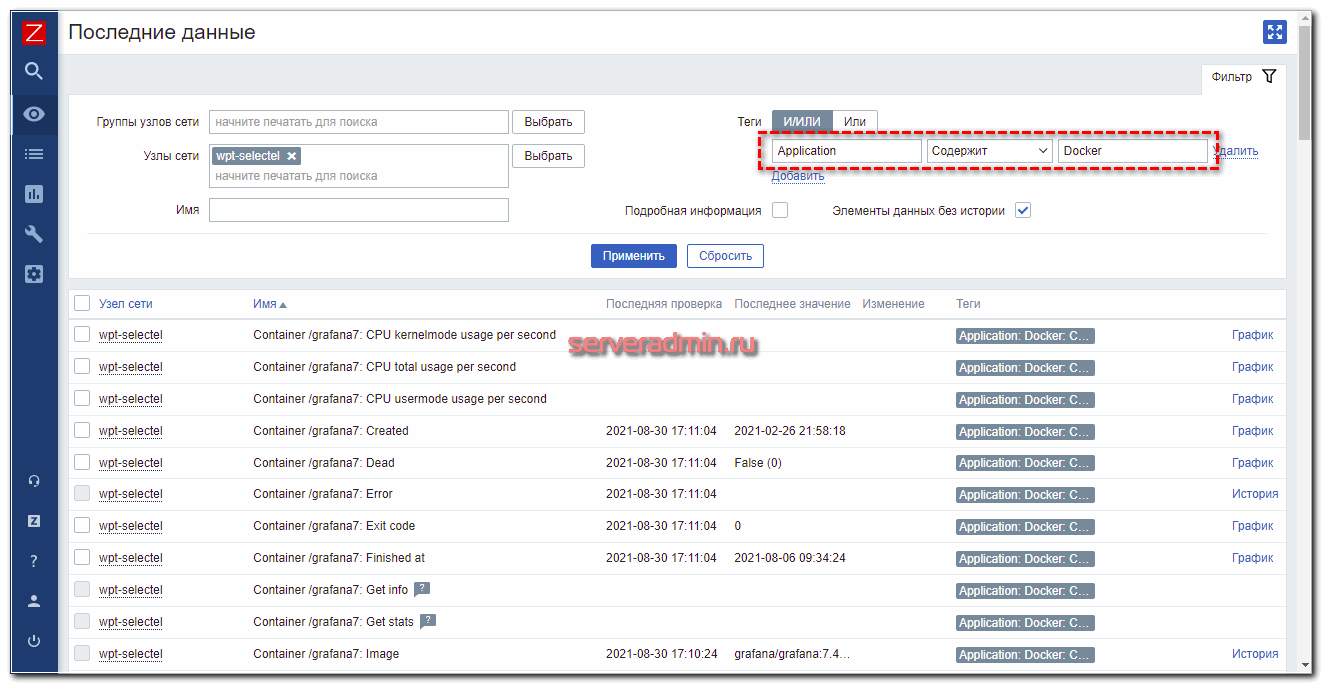
After that, containers and related items will appear in the data elements. In Latest Data, you can view metrics by tag Application: Docker
.
The template contains the following triggers:
- No information about the status of the Docker service.
- The Docker service is not running.
- Docker version has changed.
- An error in the status was fixed in the container.
- Container stopped with an error in exitcode.
The template also has the following charts:
- Number of containers with different status.
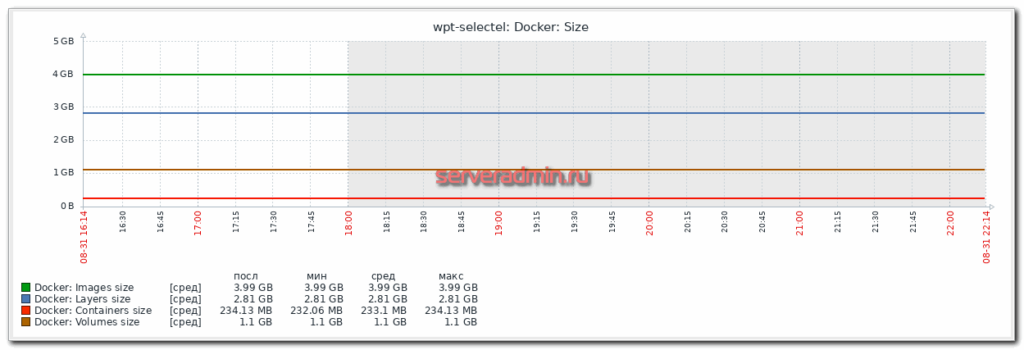
- Size of disk space occupied by various entities (images, layers, containers, volumes).
- Docker goroutines (don’t know what it is).
- Number of Images.
- Total RAM consumption by docker.
- CPU, Memory usage, network statistics separately for each container. But I didn’t understand how the CPU metric is calculated. It is presented in milliseconds. This is a calculated value that is taken from the docker json with stats, then the jsonpath $.cpu_stats.cpu_usage.total_usage is extracted, converted to changes per second, and finally an arithmetic multiplier of 1.0E-9 is used. If someone knows, tell me what this metric is. Why is she considered so?
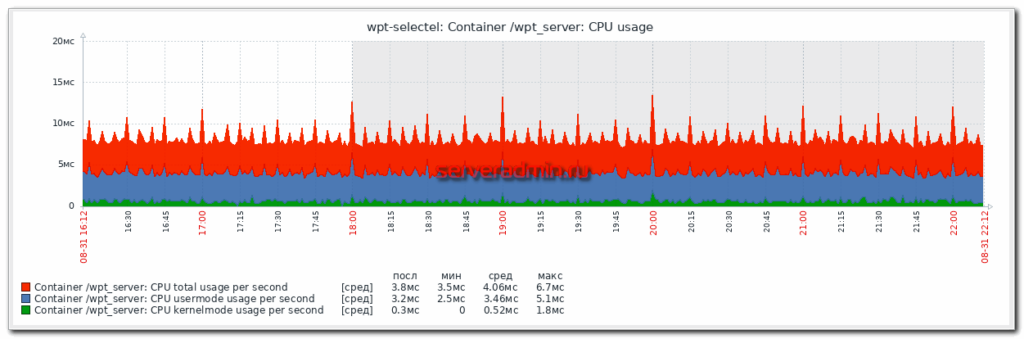
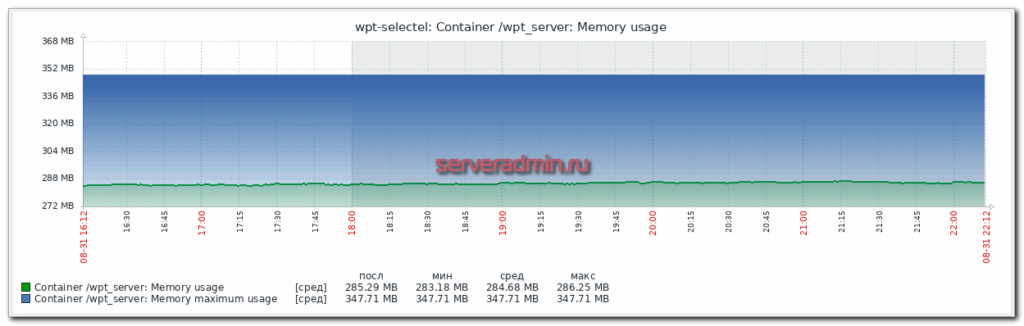
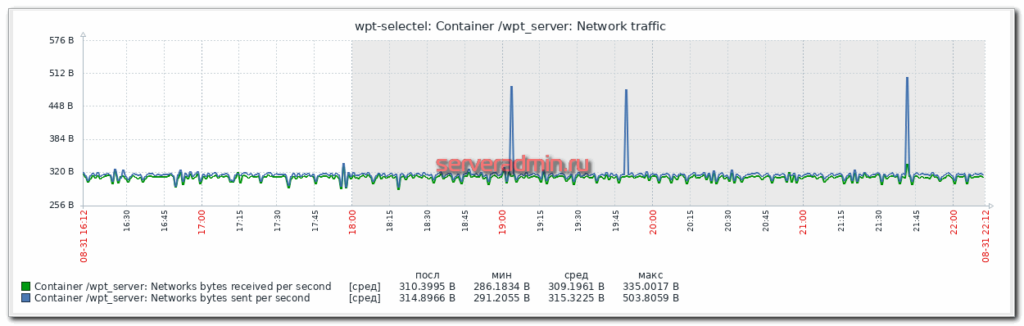
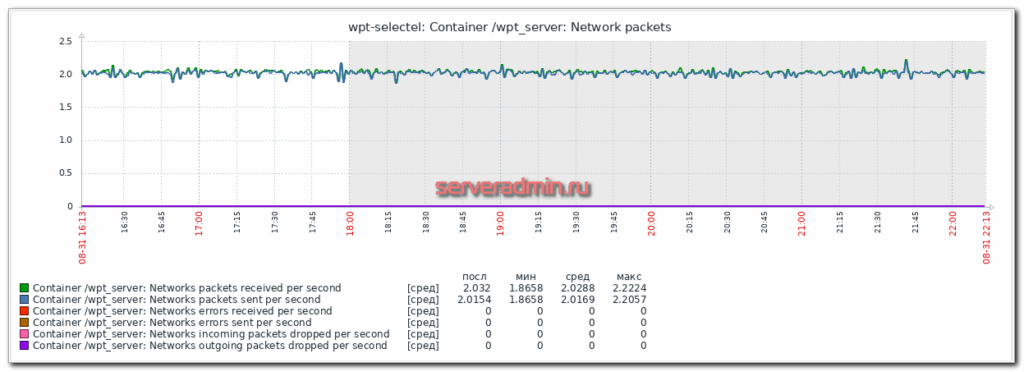
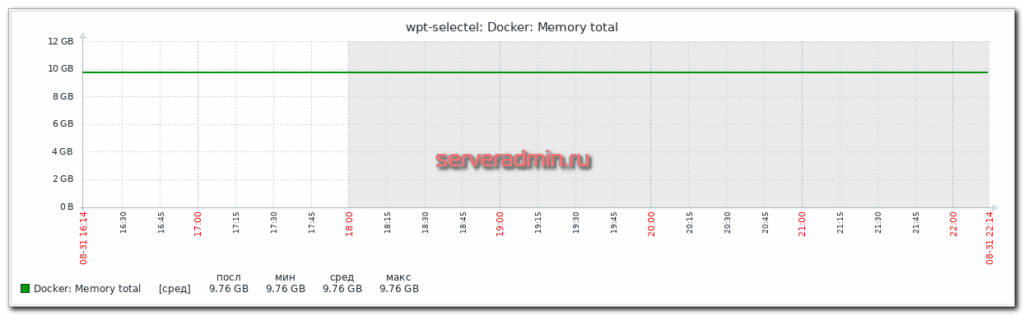
No matter how much Zabbix is buried, it is more alive than all the living and is developing in the right direction. With it, there are no problems in setting up Docker monitoring, despite the fact that it is a dynamically changing environment. All changes are tracked and monitoring is configured automatically. Operator involvement is not required. It is enough to do everything once. And there is no need to add anything either. Everything works out of the box with the standard functionality.
If you have a desire to learn how to administer Linux-based systems, but you have never worked with them and are not familiar with them, then I recommend starting with the online course “Linux for Beginners”
in OTUS. Course for beginners, for those who are not familiar with Linux. The price for the course is minimal (symbolic). Course and price information
.
Did the article help? Subscribe to telegram channel
author
Announcements of all articles, plus a lot of other useful and interesting information that does not get on the site.