Introduction
In this case, there was practically no need to change or finish anything. Both the scripts and the template are ready to be used in the original version. I will tell you in detail how I set up smart monitoring based on this information.
I will work on a CentOS 7 server, but in this case, as usual with zabbix, it does not matter. All scripts and templates are suitable for almost any linux distribution. If you don’t have your own monitoring server yet, then I recommend my materials on this topic:
Same on Debian 9 if you prefer:
We will configure in stages:
Let’s start setting up zabbix to monitor smart disks.
Preparing zabbix agent
Monitoring of hard drive SMART values will be done using smartmontools. You can install them with the following command for CentOS:
Or similar in Debian/Ubuntu
Next, we need a perl script to auto-detect disks and display information about them in JSON format that Zabbix understands. Let’s create such a script.
Save the script and make it executable.
Execute the script and check the output. It should be something like this with two disks.
In this case, I have 2 physical disks — sda and sdb. We will monitor them.
Let’s set the permission for the zabbix user to run this script, and at the same time smartctl, which we will need next. To do this, run the utility to edit /etc/sudoers.
Add one more line to the very end:
Save, exit 🙂 If you know how to work with vi. If not, then google how to work with this editor. It is he who is launched by the visudo command.
Let’s check that the zabbix user is executing the script normally.
Agent settings version 3.4
Save the file and restart zabbix-agent.
We check how our agent will give data. The uHDD.discovery key will be the same for both versions of the agent.
You should see the full JSON output with information about your drive. Now let’s see how information about smart is transmitted. Let’s request the disk temperature for version 3.2.
It’s all right. You can drive some more parameters from smart, but most likely everything will work if at least one parameter works. This completes the configuration on the agent, let’s move on to configuring the monitoring server.
Configuring SMART HDD monitoring in zabbix
I have reviewed on my site many options for using zabbix to monitor various metrics. Now I want to tell you how to set up SMART monitoring of hard disk parameters using Zabbix. I have been using this solution for a long time, but I did not write an article, since the information was completely borrowed by me. But for the sake of completeness, I decided to publish it on my website.
Monitor SMART and Disk Temperature in Windows
Initially, the article only talked about monitoring in linux systems. Over time, it became necessary to set up the same thing, only in Windows, so I decided not to start a new article, but to supplement the current one. The meaning of further actions is exactly the same as on linux. To monitor hard drives, including the temperature in windows, we will use smartmontools under windows. The script for auto-discovery and generating output in zabbix will work on powershell.
Install smartmontools. After installation, I recommend that you immediately check the work. To do this, open the command line, go to the C: Program Filessmartmontools in directory and execute:

You should see a list of all disks in the system. Then you can see information about disks, for example:
If everything is in order, disk information is displayed, continue. We need a script to parse the output. I didn’t come up with my own, besides, I practically don’t know how to write in powershell, I took a ready-made one as a basis, which implements the same functionality as described above for linux.
I slightly changed the original script, the author uses smartctl-nc.exe for some reason. It does not display anything for me at all, I did not understand what kind of executable it is. I used regular smartctl.exe. Save the script and check if it works. In order for the system to allow the execution of unsigned powershell scripts, you need to run the powershell console as an administrator and run the command:
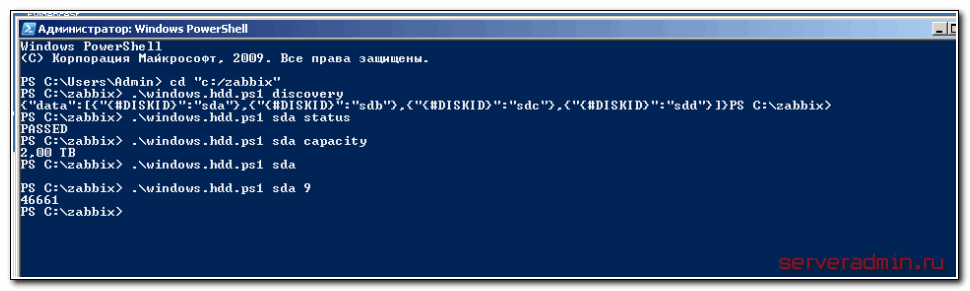
If this is not done, you will receive an error when running the script saying that the execution of scripts is prohibited for this system. I saved the script to C:zabbixwindows.hdd.ps1 directory. Let’s check his work. We launch the powershell console and the script itself with different parameters.
Don’t forget to increase the receive timeout. The default in zabbix is 3 seconds. This may not be enough. I usually set 15 seconds.
Restart the agent service and go to the server.
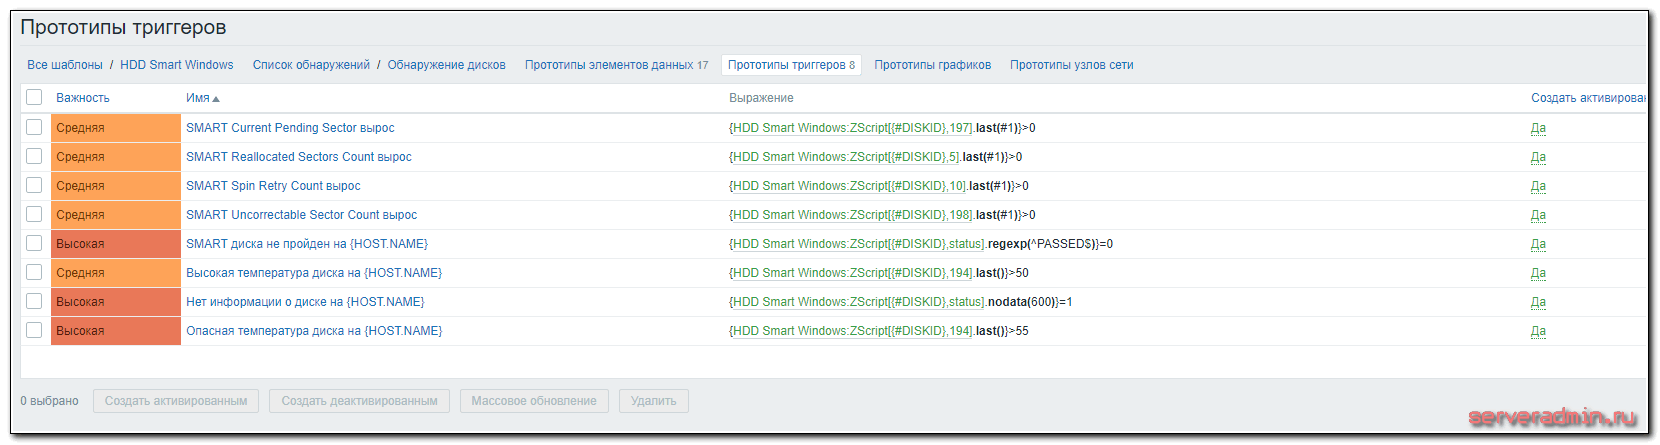
You don’t need to do anything on the server, since I did everything for you 🙂 I offer a ready-made template — zabbix-smart-win-template.xml. Download and import to your server. It works for me on server version 3.4.6. The template is configured to auto-detect disks, create items and triggers. Everything is a bit similar to what is for Linux, but nevertheless it is different, as it was done at different times and with different moods. In Linux, everything is more confused — complex triggers and items that the author of the template added. Over time, I realized that this was not really necessary and did not bother with Windows, I made everything easier, but nevertheless, all the main functionality is present.
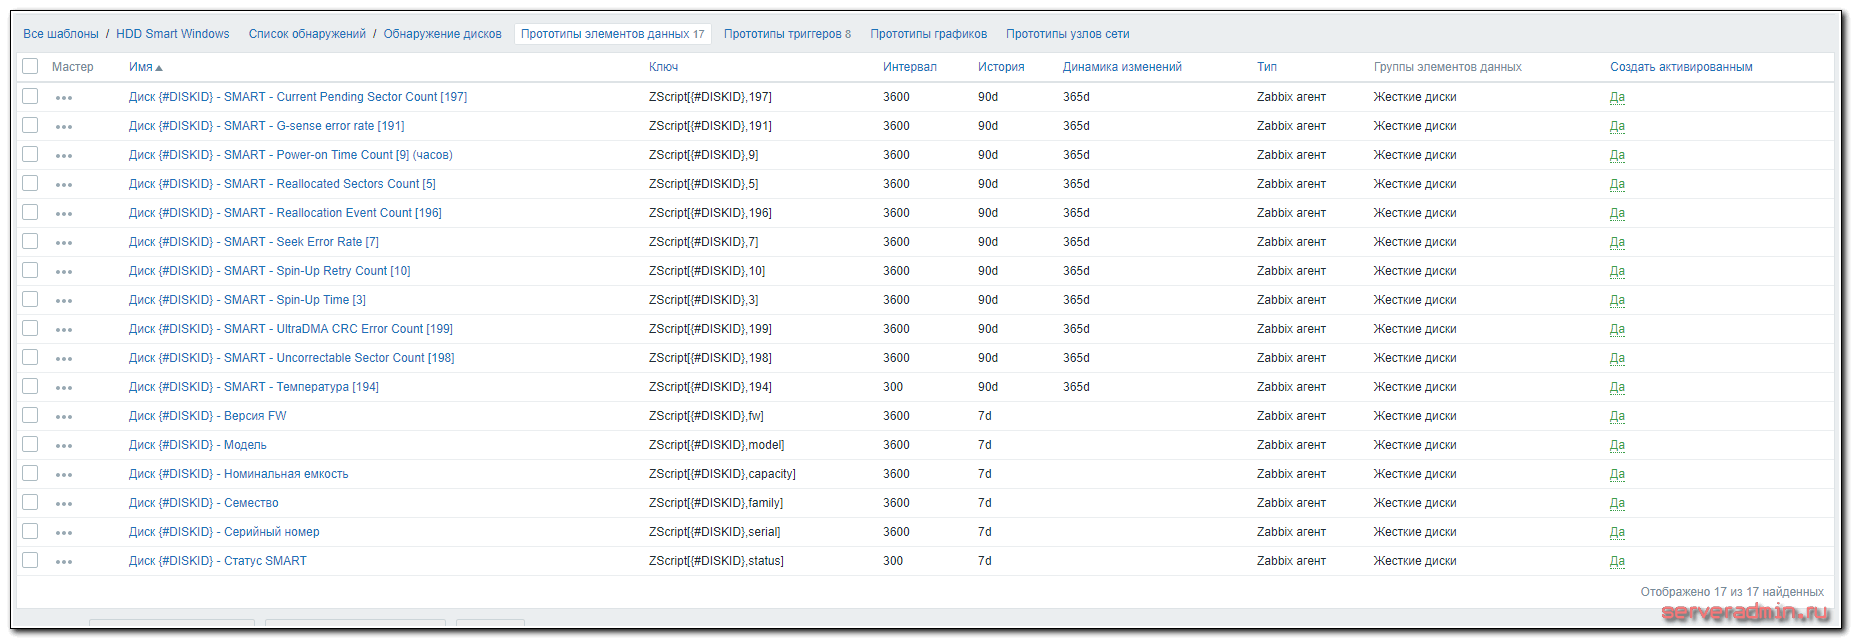
Moreover, in the windows version, I added a trigger that fires if the disk disappears from the system. I had one such disk that could just disappear. I had to make an announcement. In linux, my disks never disappeared just like that, so I didn’t think of such a trigger in my time. Below is a list of template items.
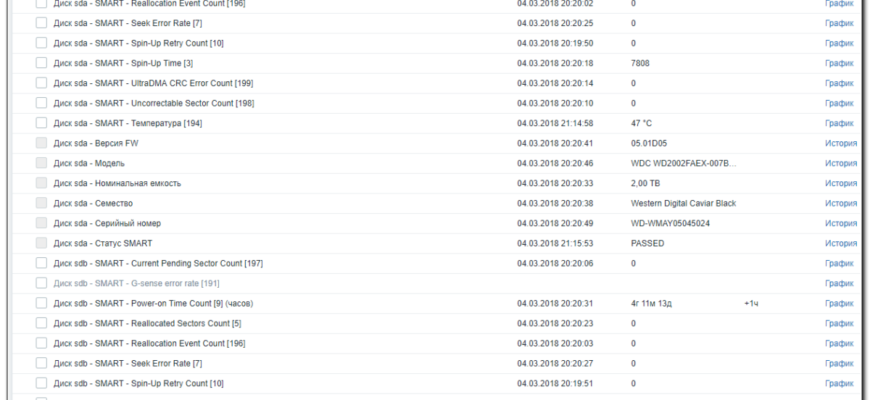
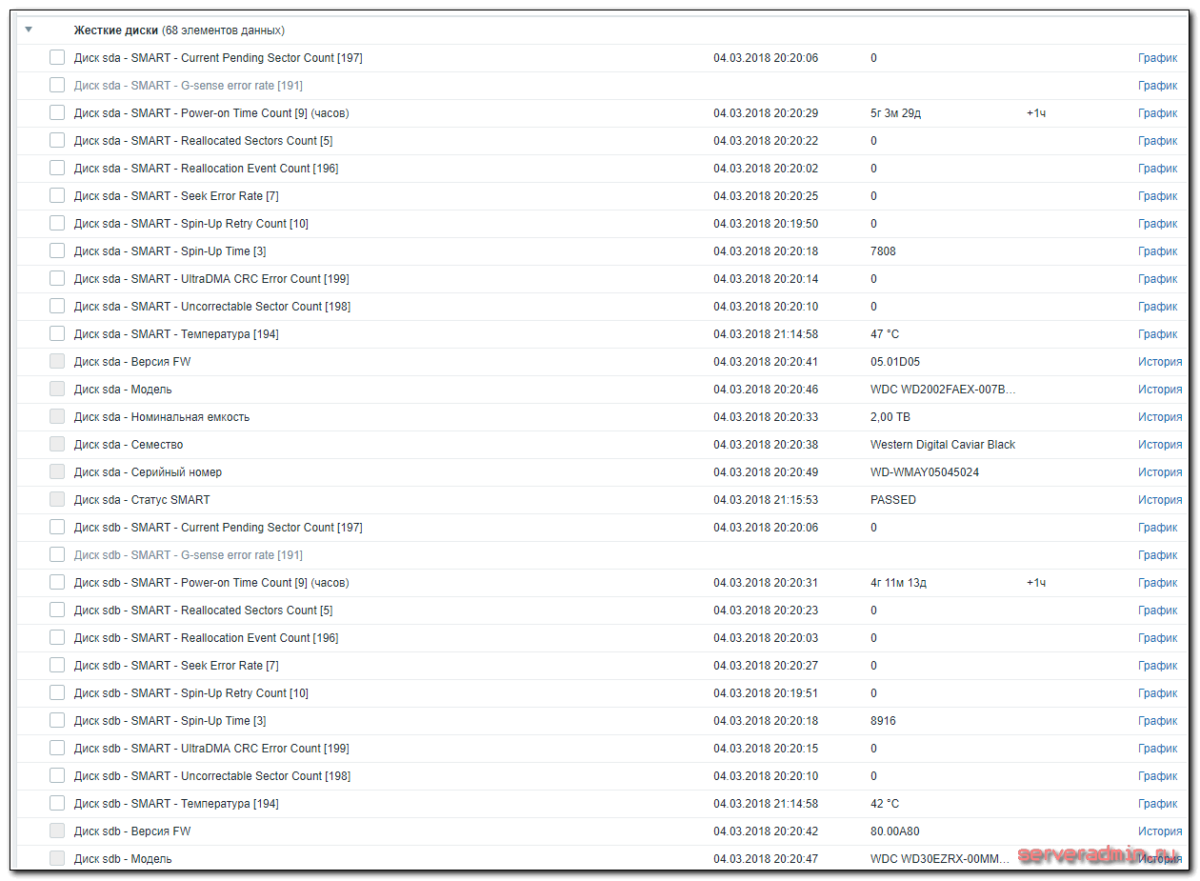
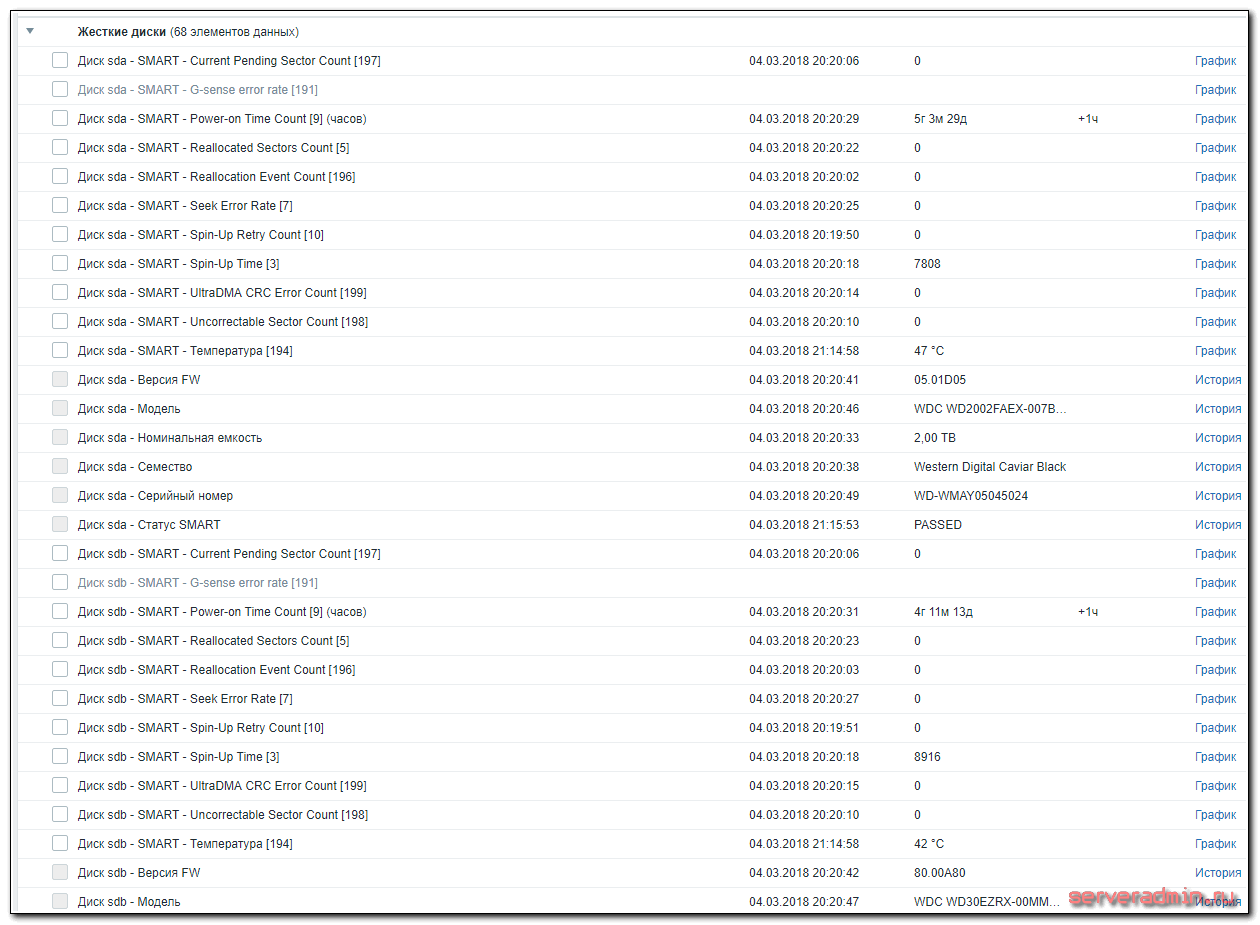
And this is the picture you will get when all the disks and their items appear on the host and start collecting data.
In general, nothing complicated. Setting up SMART and disk temperature monitoring in windows is not much more difficult than in linux. It’s good that there is the same interface with the same syntax for both drives. In windows 10, in addition, there is a full-fledged ubuntu system, it would be possible to do without powershell, but it would not be a universal solution. This method works on all versions of windows, starting with XP.
Configuring SMART Disk Monitoring
We don’t have to do any special settings on the server. It will be enough to download a ready-made template and apply it to the host of interest to us to monitor the disk.
The template can be taken from me — zabbix-smart-template.xml. I do not remember exactly whether I changed anything in it, compared to the original or not. But even if it changed, it was insignificant, most likely only the intervals for updating items. I exported this template from my server version 3.2. You can get the original templates from the authors at the link at the beginning of the post.
For zabbix server version 3.4, use the updated author template.
The interval for updating the autodiscovery rules in the template is 30 minutes, so you will have to wait about half an hour before any new smart monitoring data appears on the server. During debugging, you can change this setting manually in the template.
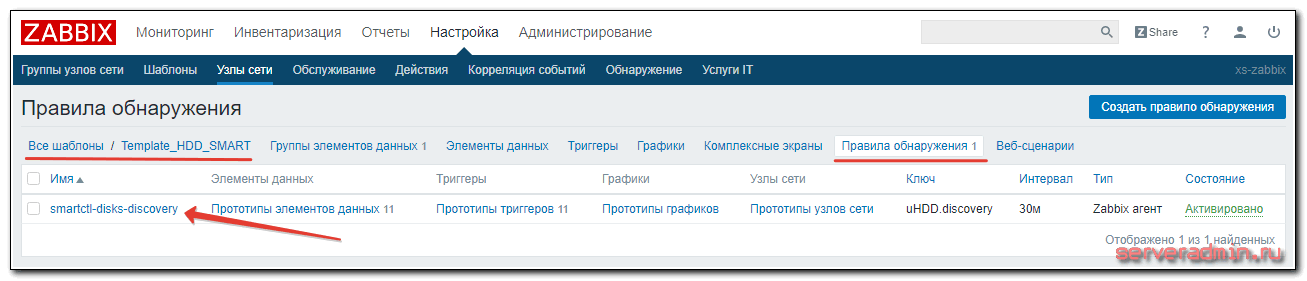
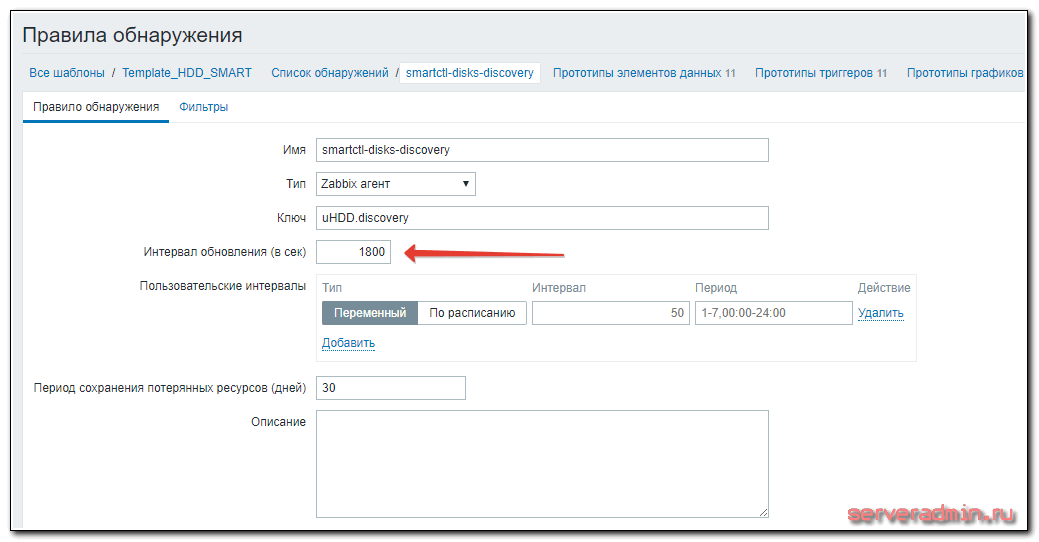
Right there, in the item prototypes, you can see other items, their parameters and update intervals. You may not need something and you can turn it off.
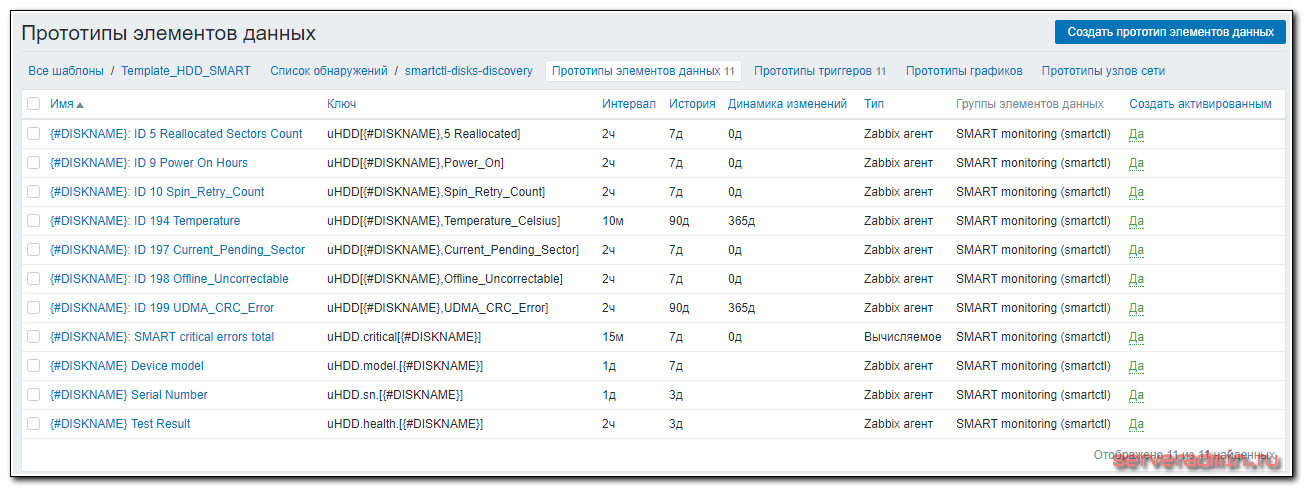
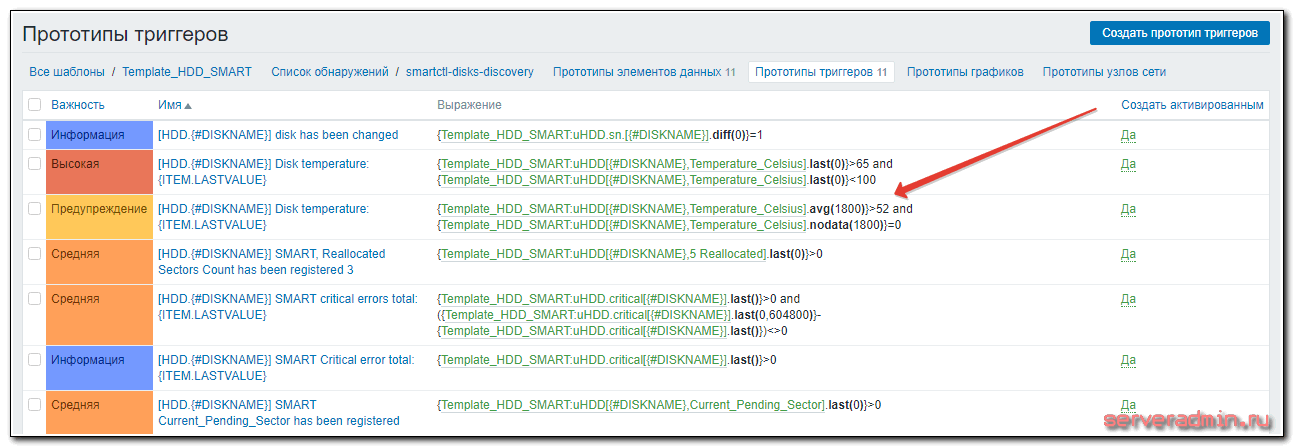
It may be useful for you to monitor the temperature of the hard disk more than once every 10 minutes. See Trigger Prototypes in the next section. Some of them are computed and will start working only after a certain amount of data has accumulated. Until then, they will show errors, keep this in mind.
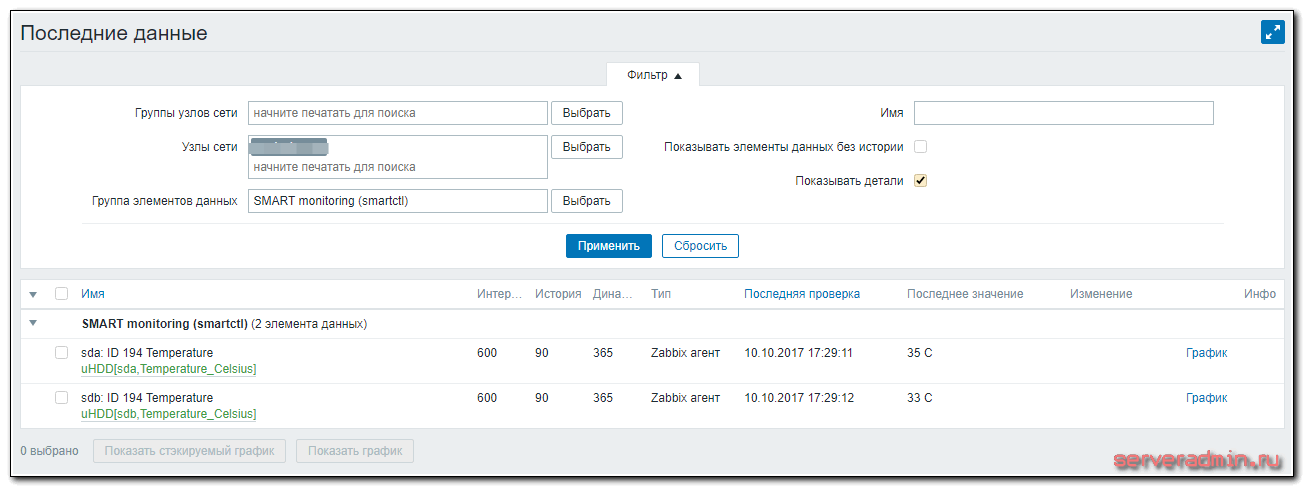
After the autodiscovery rule is triggered and the first data is received, you can check them in the «Latest data». These will be the temperatures.
Online courses on Mikrotik
For windows, the information is fully up-to-date. Just configured monitoring of normal disks on it.
Hello, I tried on 4.2 and 4.4 and rolled back to 3.4 but the same everywhere
in the web interface Item does not allow parameters
any ideas?
must try in Windows
Good afternoon. I do everything as described above, it works. But when I repeat the same thing on the servers where there is an NVME disk (OS WinS 2019), when doing .windows.hdd.ps1 discovery I get a response
the software sees them. The question is, what could be the problem and where to dig? On all other servers with the same OS, but not NVME — everything is ok!
The output for nvme disks is probably a bit different, so it is not parsed by the script as it should. Look at the script and edit it to display information from your disks.
form where everything works /dev/sda -d ata # /dev/sda, ATA device /dev/sdb -d ata # /dev/sdb, ATA device
form where /dev/sda -d nvme # /dev/sda, NVMe device /dev/sdb -d nvme # /dev/sdb, NVMe device does not work
Here https://github.com/v-zhuravlev/zbx-smartctl is the latest version of the template and scripts for monitoring all modern disks. I advise you to try, maybe you can set it up.
Understood. Essence: The script searches for devices, then checks for enabled smart, and then only it gives a list of devices. Since there is no smart in NVME, there is no answer, and a completely different method of collecting information. I corrected the script and the template for NVME, everything worked wonderfully. If you want, I can share it without any problems!
could you share the scenario? I don’t know if it’s spelled correctly, I’m Brazilian.
If possible, share the script, otherwise the Samsun 970 evo + does not give back in any way, and I’m not strong in scripts ((Thanks in advance.
PS: Ideally, you need a script for all screws at once HDD + SSD nVME + SAS
The script was not exported to the server until I changed the version of the script in it to my own. It costs 3.0, but when exporting, the error Invalid tag «/zabbix_export/templates/template
«: unexpected tag «httptests» crashes. What could it be, how to fix it? Or this script does not work and needs to be redone for 3.0?
I can’t import the template normally in 4.4, there are no errors, the template appears, but the data elements and triggers are empty
Just checked, it imports normally in 4.4. Items and triggers are empty because discovery rules are used here.
Good afternoon! I set everything up, except for the final stage. data is not included in the database. version 4.0 of zabbix_get accepts and shows everything. And on the same server there is a zabbix server. Here it simply does not accept the data received from a script in the base. Emptiness. Ping and other standard parameters get into the Zabbix database
I’ll answer myself. 3 days messed around. But I found something that got in the way. I read the logs of the zabbix server and saw that zabbix really does not receive data, although the commands are being executed. There was a small timeout in the server logs. Set it to the max. Restarted the server. And it worked.
Timeout is a dangerous thing. I too often hung over such problems. Now I always watch timeouts everywhere.
Good day. Is it possible to monitor smart on a VMWARE ESX(i) host? The only thing I found is some kind of solution for HP servers with their controllers, and I have everything on SuperMicro.
I don’t know, I didn’t understand. Taking into account the fact that ESXI is usually put on iron raids, you need to take from them the information that they can give. In theory, you need to install the controller driver for VMWARE, then all the information on the disks will be in the hypervisor control panel. From there you can pick it up. E SXI seems to be able to give information via snmp. I don’t know for sure, I’m very little familiar with ESXI, I need to figure it out.
In general, the article is working. Just set up a bunch of windows servers on it. Moreover, disks assembled in intel raid on the motherboard are monitored. Their names are not /dev/sda, /dev/sdb, but /dev/csmi0,0 /dev/csmi0,1 etc. Because of the comma in the name, an inconvenience is added, but in the end I set everything up by changing the script on the client. If someone needs it, please contact me, I’ll give you a modified script.
Does anyone have the contents of this file /etc/zabbix/zabbix_agentd.d/smart.conf for zabbix-agent 4.2.3? I can’t set it up 🙁
Please share the corrected script, the presence of a comma in the name is very inconvenient when monitoring csmi disks.
Here it is from a working server — https://yadi.sk/d/SlseG8AM32iqQA The only thing I don’t understand is why the formatting is normal from one computer when opening a file, and from the other a bunch of extra empty lines appear.
What other ideas are needed here if it says in plain text: «Could not load the file C: asusmart_hdd.ps1 because script execution is prohibited for this system.» We need to solve this problem.
and if you write directly?
Alex, thank you. So it worked!
Yes, everything looks much simpler and more convenient. Will have to check just in case.
sorry for «Anonymous»
Yes, I checked and use it all the time, but a little for other metrics, although the principle is the same. I liked the method without agents.
In order for the “Value should be a JSON object” error to disappear and data on “Windows disks” begin to enter the monitoring system, I ask the author of this article to make the following adjustments to the “Monitoring SMART and Disk Temperature in Windows” section.
1. After the words «Timeout=15» add the text: «Now you need to make adjustments to the PATH line of the system variables. To do this, open «Control Panel — System and Security — System — Advanced Settings — Environment Variables» and go to «System Variables» (lower part). Next, look for a line called “PATH” there and add (double-click or click the “Change” button) to the end the following parameters “%systemroot%System32WindowsPowerShell 1.0;” and «C:Program Filessmartmontools in» separating them (no spaces. ) with a semicolon!
As a result, the ENTIRE line will look like this: %SystemRoot%system32;%SystemRoot%;%SystemRoot%System32Wbem;%systemroot%System32WindowsPowerShell 1.0;C:Program Filessmartmontools in
In order for the changes to take effect, you need to restart the “machine” (computer / laptop).
Next, we go to the Zabbix server and check that the Zabbix agent provides the results of our PowerShell script. To do this, launch the terminal and enter the following commands:
where 192.168.25.11 is the address of our client computer under Windows OS, on which we have just configured the Zabbix agent.
Successful execution of the above commands will display the status and size of your disk on the client computer.
2. Next, we replace the sentence “You don’t need to do anything on the server, since I did everything for you.” to «After that, we go to the web management interface of the Zabbix server and import the template we need.»
As a result, they constantly gave me incomprehensible “kryakozyabry”. To understand what’s the matter, I redirected their output to a separate text file. Then I copied it to a computer with Windows OS and using the AkelPad program I selected the correct encoding — it turned out to be the OEM-866 encoding. As a result, I received the following text «»powershell» is not an internal or external command, executable program or batch file.
So NO changes to the template or the PowerShell script for «monitoring SMART and disk temperature in Windows» DO NOT NEED to be made, You only need to add two parameters to the «PATH» line of «System Variables» (see above) .
Thank you for your understanding!
Thank you, I had the same error, your solution helped
Thank you all for a great article. I use the script of the respected SnowBars
Missing closing ‘)’ after expression in ‘if’ statement. At SmartScanZabbixAgent.ps1:13 char:26 + foreach ($obj in $items) <+
Most likely something with the paths, because these errors indicate that Posh cannot run the samrtctl utility. Accordingly, all its keys also cause errors. See where smartmontools is launched from and where the powershell script is accessing.
Thanks for the great article!
2) In order for everything to work when the agent is running under “local system”, I slightly corrected the ps1 file: at the beginning we declare “$smartctl=’C:Program Filessmartmontools insmartctl.exe’” and then we replace all the entries with “smartctl” on «&smartctl» IMHO this made the script a little more versatile.
Well, for the convenience of debugging in catching errors “catch” instead of “catch“. Then it became clear that the local system does not see systemctl.
Excellent, thanks for the comments on the merits.
Thanks for the useful info. These kinds of settings never work out of the box for everyone. A lot of nuances. It is rather a plan for action with someone else’s experience. And changes are being made on the spot.
Of course! That’s why I wrote down all my misadventures in order to help someone and simplify life. B TW, thanks for the article.
Dear SnowBars! Please share your working (modified) scripts and template!
We fasten monitoring of smart parameters or any temperature (cpu, motherboard) to Zabbix
Actually, I didn’t find a bunch of articles on how to attach monitoring of any temperature to zabbix, so I decided to write my own.
Task1. We have installed and configured the monitoring system zabbix 1.8.2. It is necessary to fasten temperature monitoring of hard drives (or any other smart parameter) on a linux server (debian). Go. 1. Install the smartmontools package. 2. Team
displays all smart parameters, we are looking for the temperature value there. 3. My parameter is called Temperature_Celsius. 4. Next, you need to select the temperature value from the output of the smartctl command. This can be done in one line, but the problem is that zabbix-agent will run this command as the zabbix user, and it requires root privileges. Of course, you can add a zabbix user to sudoers, or something else, but I just added a script launch
in crontab with a launch frequency of 15 minutes (of course, it strains to write to syslog every 15 minutes, then I can redo it). 5. Now we add a user parameter to the zabbix agent config, in which we select only the last three bytes of the file (after grep, we get a line in which the last two characters are the temperature of the hard drive, the third character is probably the end of the line)
and most likely we see that we are sent to sensors-detect. 3. Launch
we answer yes to all questions except the last one. If there are supported hardware, then we see (in my case) something like this
To load everything that is needed, add this to /etc/modules: #—-cut here—- # Chip drivers coretemp f71882fg #—-cut here—-
Linux online course
Monitoring the smart values of a hard drive is quite a useful thing, but you should not blindly trust it. I’ve had situations where Bad Sector Count drives have worked for years. It is important to look at the dynamics and the status of the server. If it is critical, then at the slightest sign of a malfunction, I would change the disk. If this is a custom file dump with a raid, then if the disk does not degrade over time, you can not touch it.
Another important nuance is that such monitoring of hard drives is possible only if you do not use a raid controller. If you have it, then most often you will not be able to see the parameters of smart drives. You will need to use the raid controller manufacturer’s utilities and configure monitoring through them.